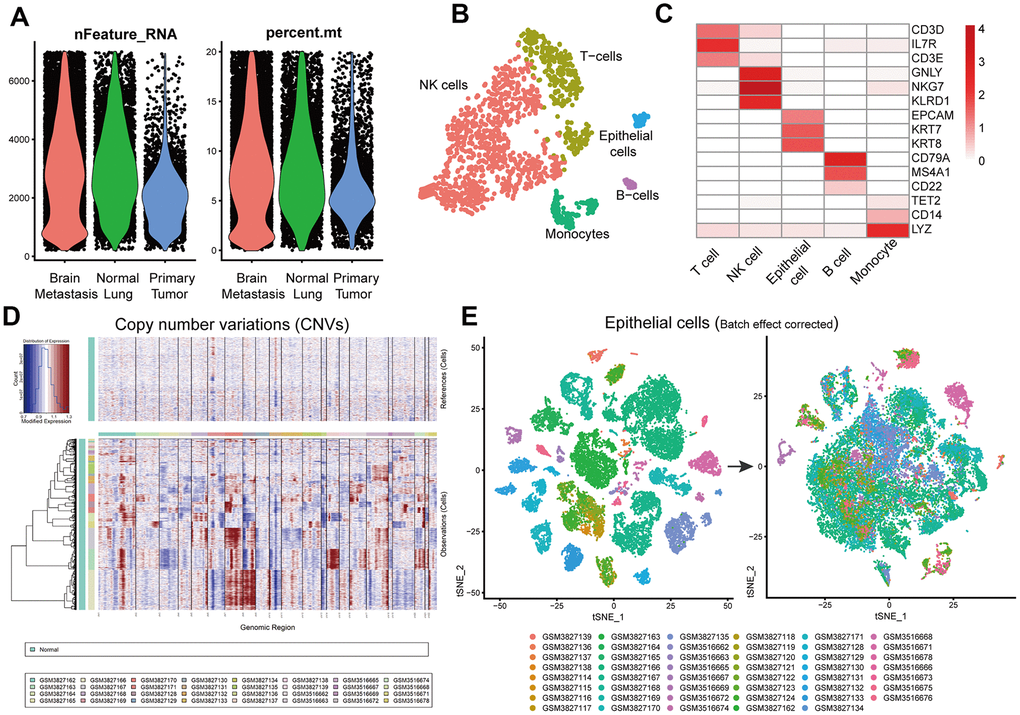
Figure 2.Identification of normal lung epithelial cells and tumor cells. (A) Violin plots show genes numbers and the percentage of mitochondrial genome per single cell from the primary LUAD and brain metastatic tissues, and the normal lung tissues from the GSE123902 [13] and GSE131907 [14] datasets. (B) The tSNE plot demonstrates five different cell types in a single non-tumor lung tissue sample and highlights annotation accuracy of the Single R package analysis. (C) Heatmap shows the expression of marker genes in different cell types from a single non-tumor lung tissue sample. (D) InferCNV plot shows diverse chromosomal copy number variation (CNVs) in the tumor cells from primary and metastatic LUAD tissue samples. Normal lung tissue samples are used as controls. (E) Seurat analysis results with batch effect correction after integrating primary and metastatic LUAD and normal lung epithelial cells.