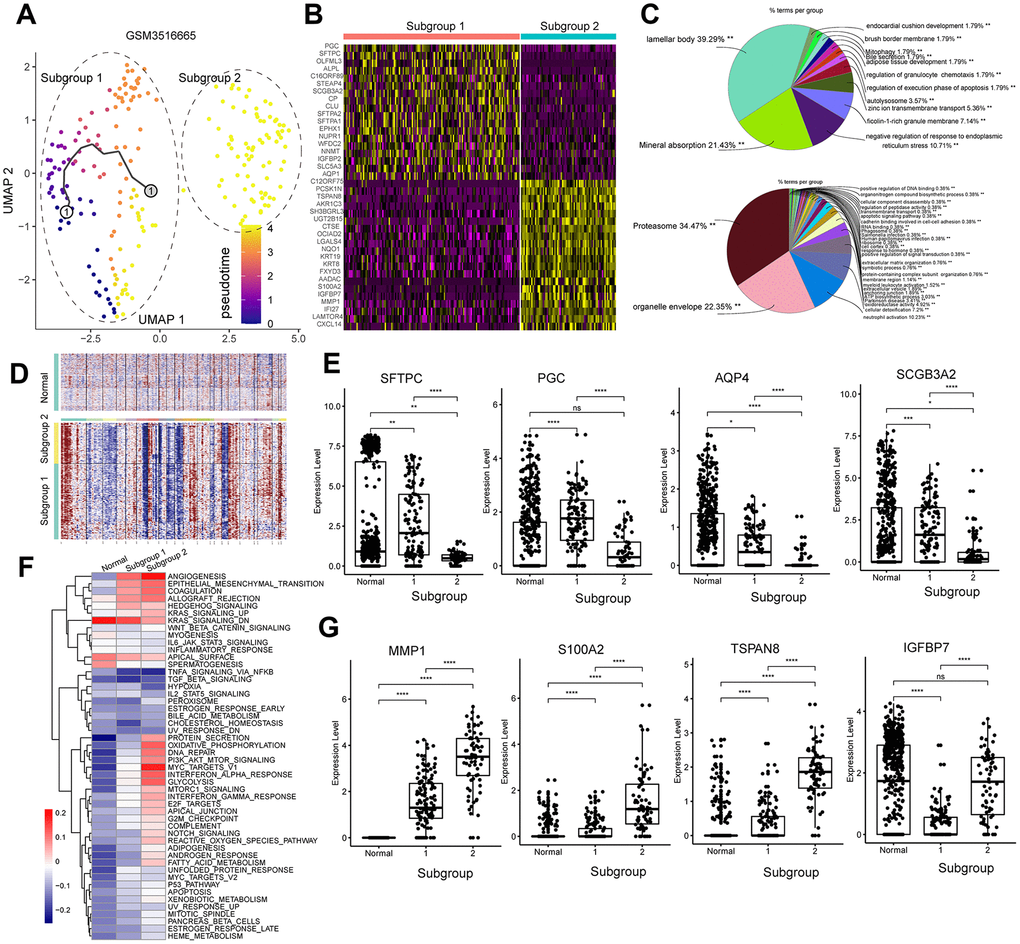
Figure 7.Analysis of the tumor cell subgroups in the stage IV primary LUAD sample, GSM3516665. (A) UMAP plot shows the different trajectories of two tumor cell subgroups from the GSM3516665 sample. (B) Heatmap shows the DEGs between the two tumor cell subgroups from the GSM3516665 sample. (C) Pie graphs show the results of the functional enrichment analysis of the DEGs between the two tumor cell subgroups from the GSM3516665 sample. (D) InferCNV plot shows significant copy number variations in the chromosomes of the two tumor cell subgroups from the GSM3516665 sample in comparison with the normal lung epithelial cells. (E) Heatmap shows the gene set variation analysis of the two subgroups from the GSM3516665 sample and the normal lung epithelial cells. The color code in the heat maps ranges from navy blue to red and shows progression from low to high expression of the gene sets. (F) Gene expression analysis shows that genes associated with the normal type II alveolar Type cells such as SFTPC, PGC, AQP4, and SCGB3A2 are upregulated in the subgroup 1 cells from the GSM3516665 sample. (G) Gene expression analysis shows that genes associated with tumor progression such as MMP1, S100A2, TSPAN8, and IGFBP7 are upregulated in the subgroup 2 from the GSM3516665 sample.