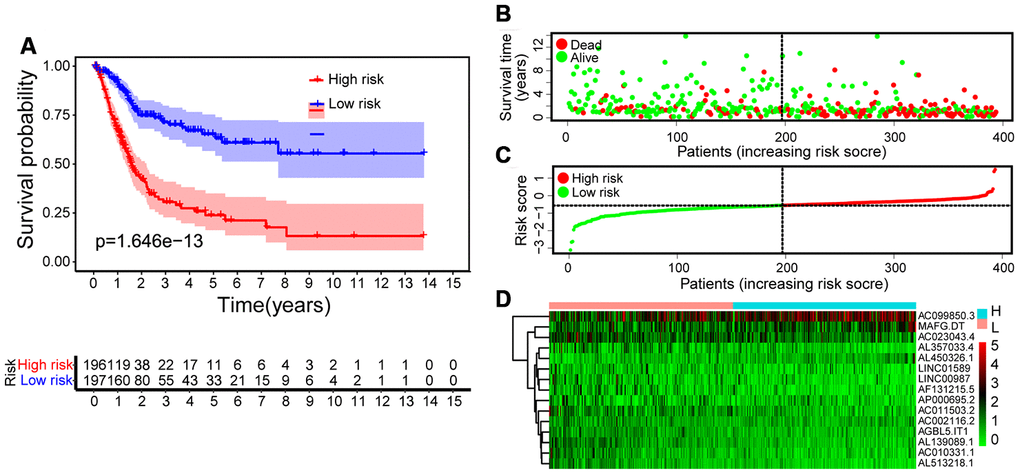
Figure 4.Construction of risk score model. (A) Kaplan-Meier survival analysis of bladder cancer patients shows that the high-risk group had significantly worse OS than the low-risk group. (B) Survival rate and survival status of bladder cancer patients. (C) The distribution of 15-lncRNA risk scores for each patient. (D) Heatmap of 15 lncRNAs in the low-risk group and the high-risk group. Cold colors represent low expression and warm colors represent high expression.