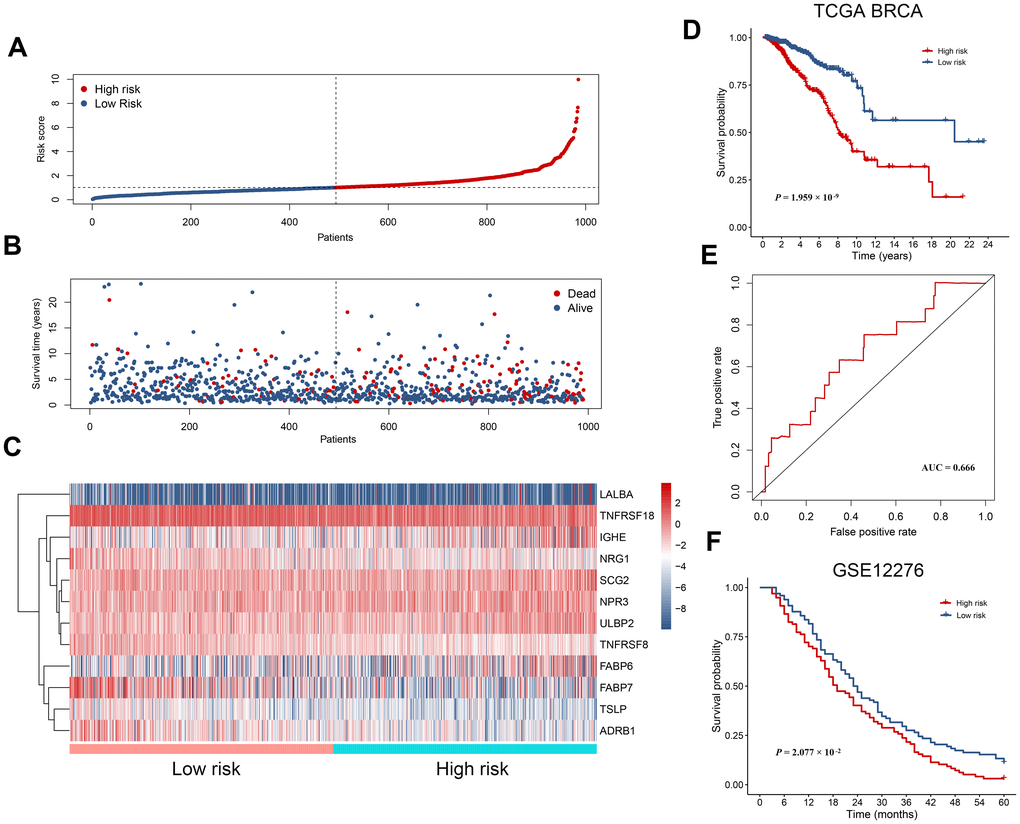
Figure 5.The prognostic immunity-based signature in breast cancer. (A) Distribution of risk score derived from the signature. Patients are ranked according to the corresponding risk score. (B) Survival status of breast cancer patients. They are ranked in the same way as in (A). (C) Heatmap showing expression of the 12 hub immunity-related genes in different risk groups. (D) Kaplan-Meier survival curves for patients in the TCGA BRCA dataset. Patients are assigned into high and low risk groups according to the median risk score. (E) The receiver operating characteristic (ROC) curve showing a prognostic value of the immunity-based signature. (F) Kaplan-Meier survival curves for patients in the validation dataset (GSE12276).