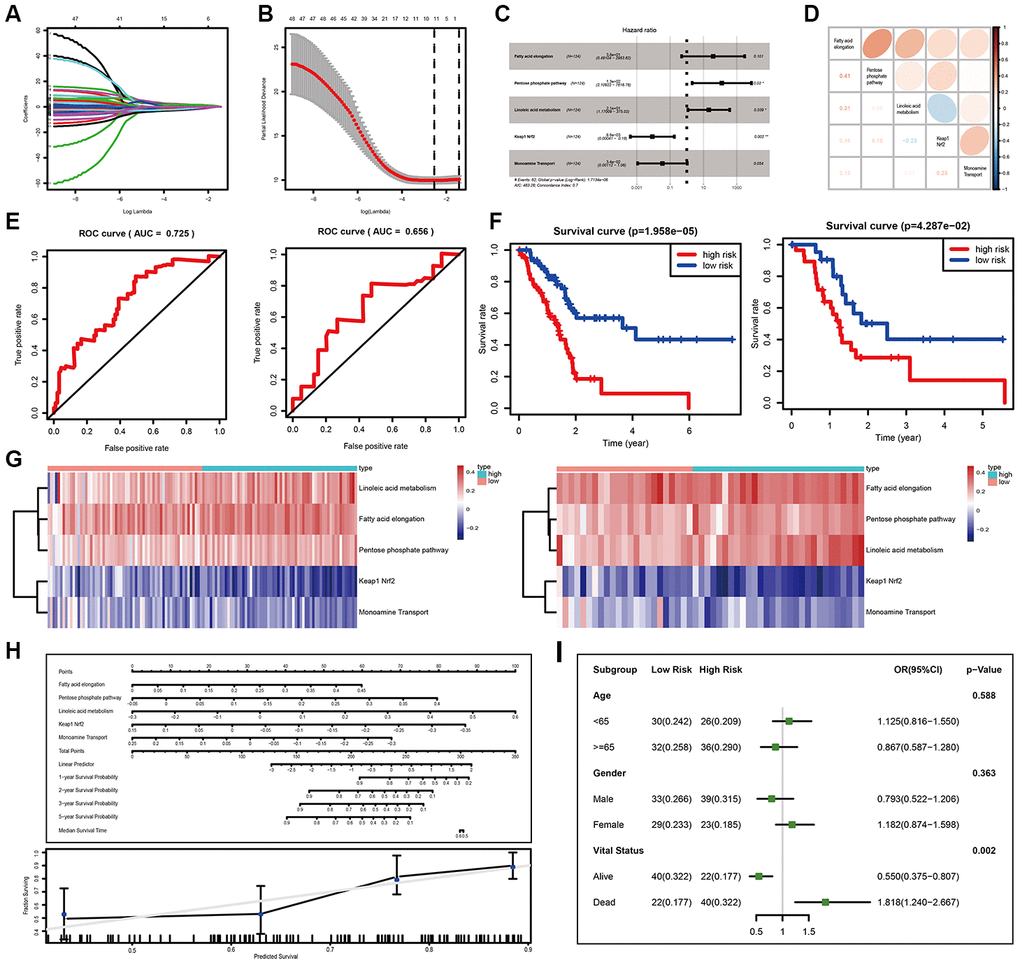
Figure 2.Development and validation of the miPPSPC. (A, B) Least absolute shrinkage and selection operator (LASSO) regression of the pathway enrichment scores of 48 miRNA sets in the training group calculated by the GSVA method. LASSO coefficient profiles of 48 pathways were shown in panel (A) and the dotted line indicated the value chosen by tenfold cross-validation. Tenfold cross-validation for tuning parameter selection in the LASSO model was shown in panel (B). The partial likelihood deviance was plotted against log (λ), which was the tuning parameter. Partial likelihood deviance values were shown, while error bars represented s.e. The dotted vertical lines were drawn at the optimal values by minimum criteria and 1 - s.e. criteria. In (A) and (B), the numbers above the graph represent the numbers of pathways involved in the LASSO model. Through the LASSO regression process, 11 of 48 miRNA set-based pathways were filtered for subsequent analysis. (C) Forest plot of five pathway-related parameters originating from the Cox proportional hazards model miPPSPC. Through constructing Cox proportional hazards model, 5 of 11 pathways were finally filtered. Unadjusted hazard ratios are shown with 95 percent confidence intervals. AIC, Akaike Information Criterion. (D) Correlations among five pathways calculated using pathway enrichment scores of five pathways for PC patients. Red indicated a high correlation, while blue indicated a low correlation. Color depth represented the level of correlation. Correlation coefficients were represented by numbers in the lower left triangle. (E) Receiver operating characteristic (ROC) curve of the miPPSPC for the training set (left) and validation set (right). AUC, the area under the curve. (F) Kaplan–Meier curves for overall survival by risk score of patients in the training set (left) and validation set (right) based on the miPPSPC. Blue line represented low risk group while red line represented high risk group. Log rank test was used to generate p value. (G) Heatmap of the pathway enrichment score distribution of five pathways in the training set (left) and validation set (right). The color change represented the level of pathway enrichment scores of every PC patient for every miRNA set-based pathway: blue represented a low score, and red represented a high score. Patients were divided into low and high risk group according to their risk score. (H) Nomogram (upper) of the miPPSPC exhibited a strong correlation among the pathway score, risk score and survival probability. Calibration curve (lower) for the median survival time from the nomogram of the miPPSPC. On the calibration curve, the x-axis represents nomogram-predicted survival, while the y-axis represents observed survival. (I) Forest plot of the odds ratio in high-risk and low-risk PC patients based on age, sex and vital status. The risk scores of each patient were calculated based on the miPPSPC, which contains five pathways: fatty acid elongation, the pentose phosphate pathway, linoleic acid metabolism, monoamine transport and Keap1-Nrf2.