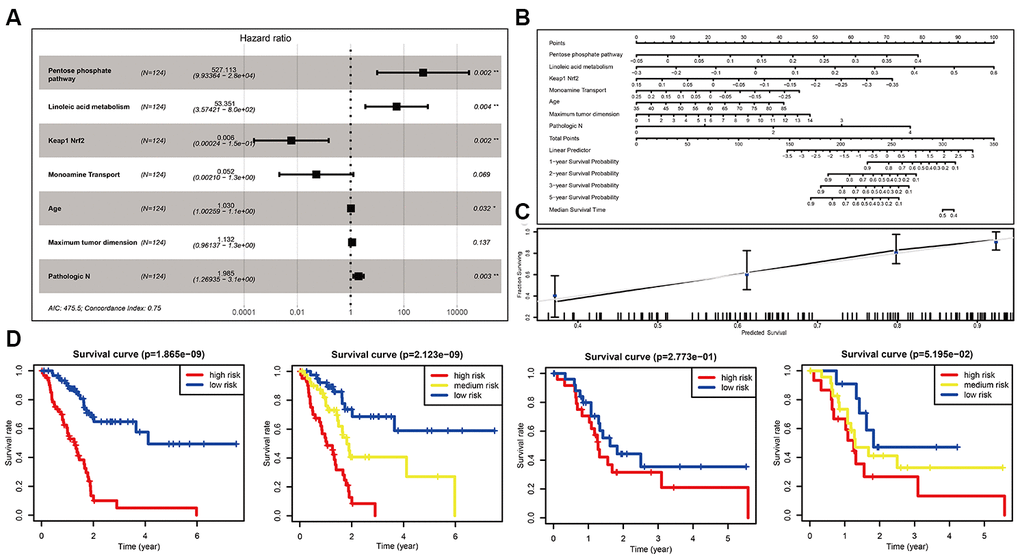
Figure 3.Optimization of the miPPSPC. (A) Forest plot of four pathways and three clinical indexes originating from the optimized Cox proportional hazards model. Through constructing Cox proportional hazards model, four pathways and three clinical indexes were finally filtered. Unadjusted hazard ratios are shown with 95 percent confidence intervals. AIC, Akaike Information Criterion. (B) Nomogram of the optimized miPPSPC that exhibits correlations among the pathway score, clinical indexes, risk score and survival probability. (C) Calibration curve for the median survival time from the nomogram of the optimized miPPSPC. On the calibration curve, the x-axis represents nomogram-predicted survival, while the y-axis represents observed survival. (D) Kaplan–Meier curves for overall survival by risk score of patients in the training set and validation set based on the optimized miPPSPC. Blue line represented low risk group, yellow line represented high risk group, and red line represented high risk group. Log rank test was used to generate p value.