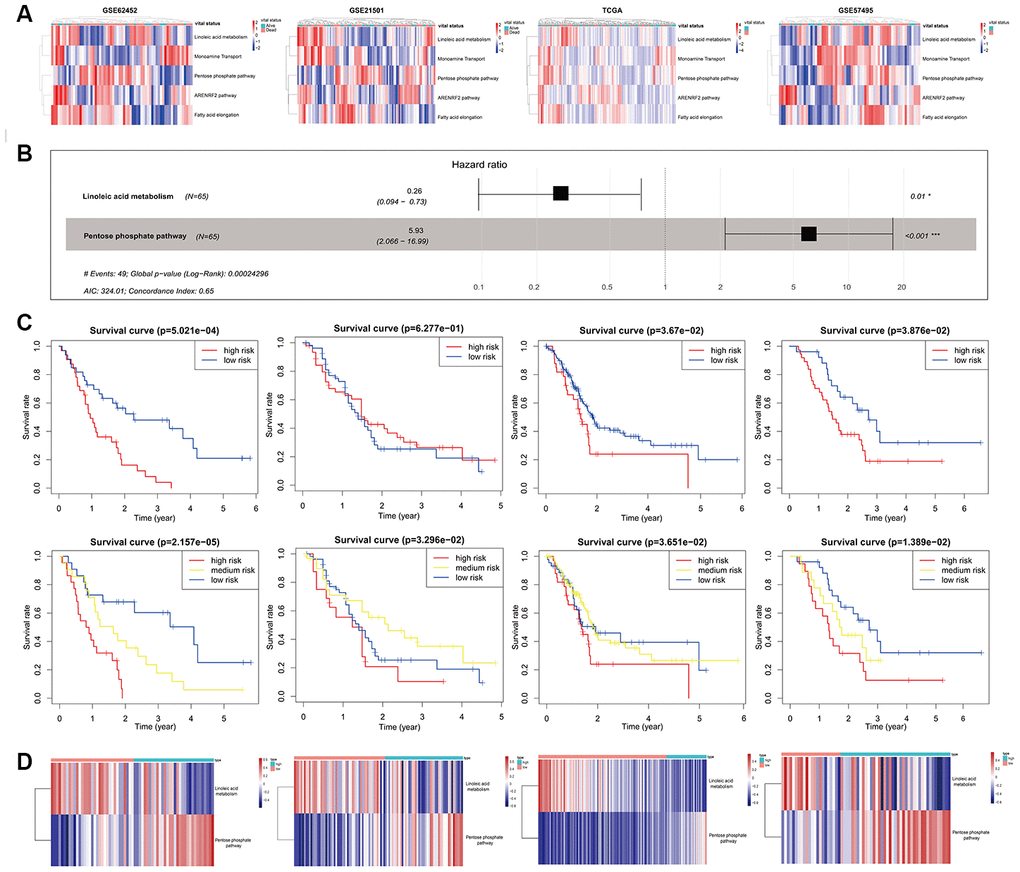
Figure 4.Development and validation of the mPPSPC. (A) Heatmap of the pathway enrichment score distribution of five mRNA-set-based pathways corresponding to miRNA-set-based pathways in the GSE62452, GSE21501, TCGA-PAAD mRNA-seq and GSE57495 datasets. Pathway enrichment scores were calculated by the GSVA method. PC patients were divided into two groups according to their vital status. The color change represented the level of pathway enrichment scores of every PC patient for every mRNA set-based pathway: blue represented a low score, and red represented a high score. (B) Forest plot of two pathways originating from the Cox proportional hazards model mPPSPC. Through constructing Cox proportional hazards model, two pathways were finally filtered. Unadjusted hazard ratios are shown with 95 percent confidence intervals. AIC, Akaike Information Criterion. (C) Kaplan–Meier curves for overall survival by risk score of patients in the training set (left two: GSE62452 dataset) and validation set (right six: GSE21501, TCGA-PAAD mRNA-seq and GSE57495 datasets) based on the mPPSPC. Blue line represented low risk group, yellow line represented high risk group, and red line represented high risk group. Log rank test was used to generate p value. (D) Heatmap of the pathway enrichment score distribution of two pathways in the mPPSPC for the training set (left one: GSE62452 dataset) and validation set (right three: GSE21501, TCGA-PAAD mRNA-seq and GSE57495 datasets) grouped by low and high risk scores. The color change represented the level of pathway enrichment scores of every PC patient for each mRNA set-based pathway: blue represented a low score, and red represented a high score.