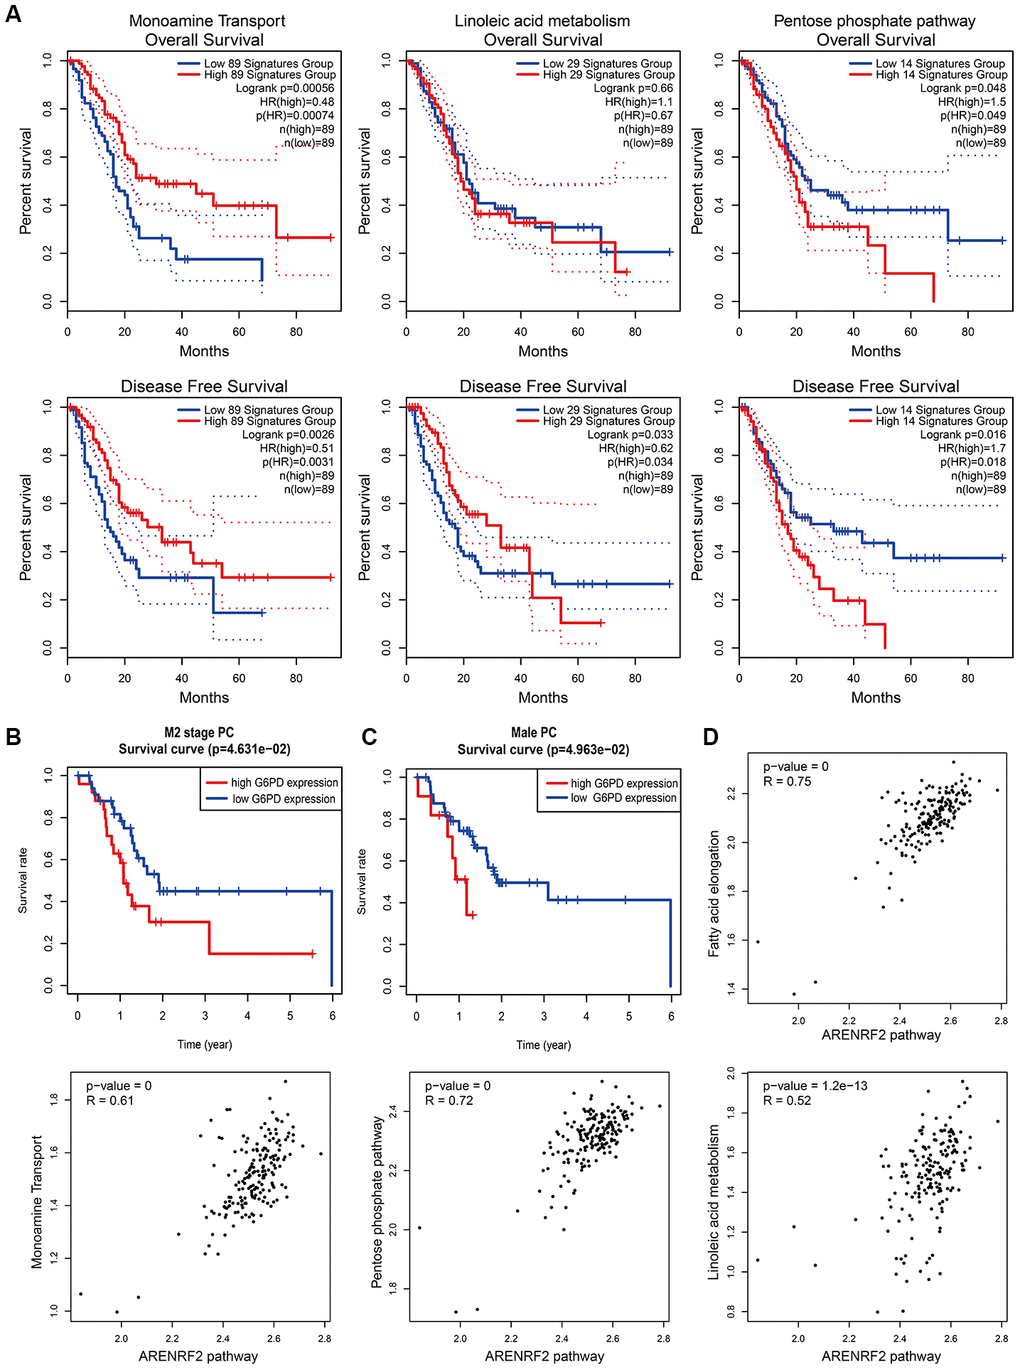
Figure 5.Effects and relationships of metabolic pathways on the prognosis of PC. (A) Overall survival (upper) and disease-free survival (lower) in PC patients with different expression patterns of monoamine transport (left), linoleic acid metabolism (middle) and the pentose phosphate pathway (right). Low and high expression patterns of pathways were divided by the pathway scores of PC patients calculated by the GEPIA2 tool. Blue line represented low pathway scores group and red line represented high pathway scores group. (B, C) Kaplan–Meier curves for overall survival of M2 stage (B) and male (C) PC patients with different G6PD protein expression levels. Protein expression of G6PD in PC was obtained from the TCGA-PAAD reversed-phase protein array. PC patients with incomplete clinical information were excluded. Blue line represented low G6PD expression group and red line represented high G6PD expression group. (D) Correlation between metabolic pathways and the oxidative stress pathway in PC patients. Pathway scores were calculated by the GEPIA2 tool according to gene expression in each pathway. Each dot represented specific pathway score of every PC patient.