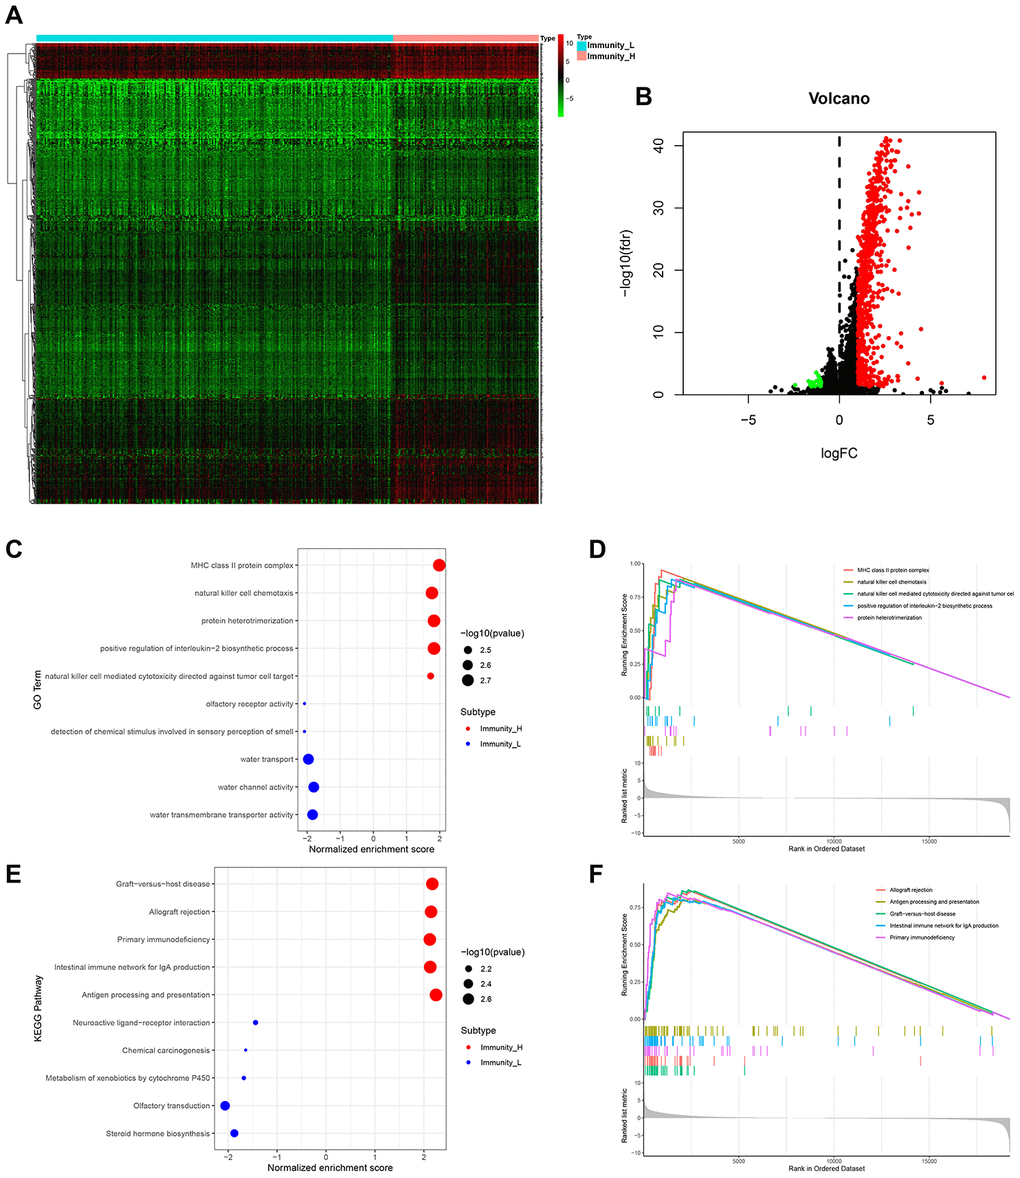
Figure 2.HCC subtype-specific gene expression profiles. (A, B) Heatmap and volcano plot of differentially expressed genes between Immunity_H and Immunity_L. Red, green and black dots indicate upregulated, downregulated and unchanged genes. It also applies to the following figures. (C–F) Significantly enriched GO terms (C, D) and KEGG pathways (E, F) of HCC subtypes.