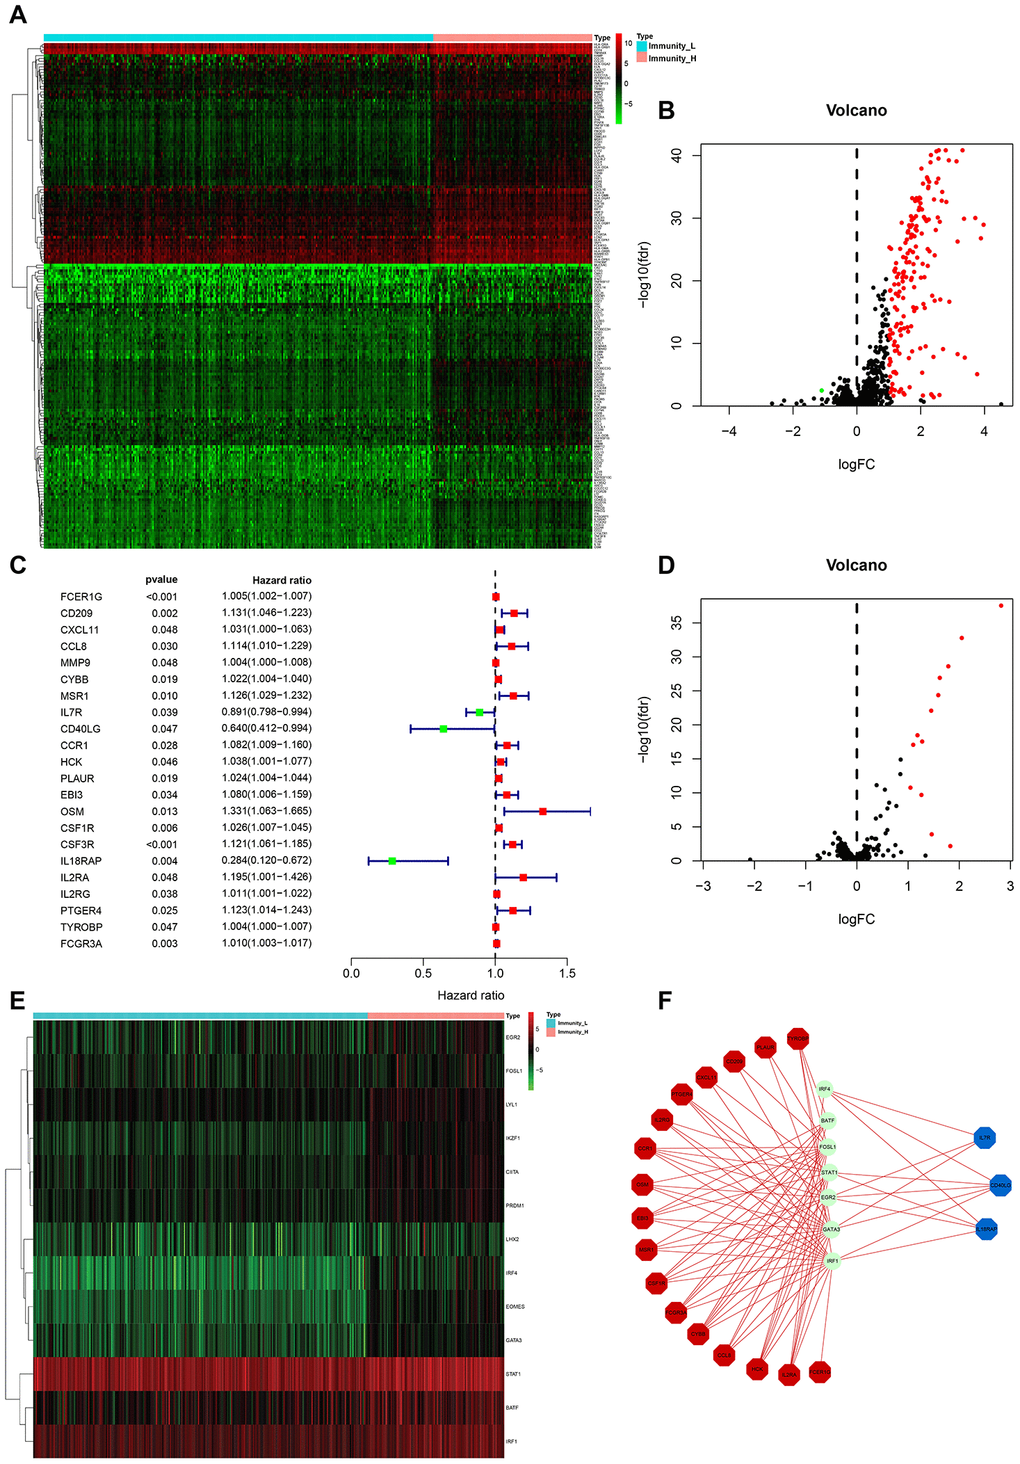
Figure 3.HCC subtype-specific differentially expressed IRGs. (A, B) Heatmap and volcano plot of the differentially expressed IRGs between Immunity_H and Immunity_L. (C) Forest plot of hazard ratios and corresponding 95% confidence intervals were estimated from univariate Cox’s regression analyses. Variables significantly associated with a good and poor OS are shown in green and red, respectively. (D, E) Volcano plot and heatmap of the differentially expressed TF genes between Immunity_H and Immunity_L. (F) Combinatorial TFs-IRGs regulation networks. Red, blue, and green, indicate high risk genes, low risk genes, and TF genes. It also applies to the following figures.