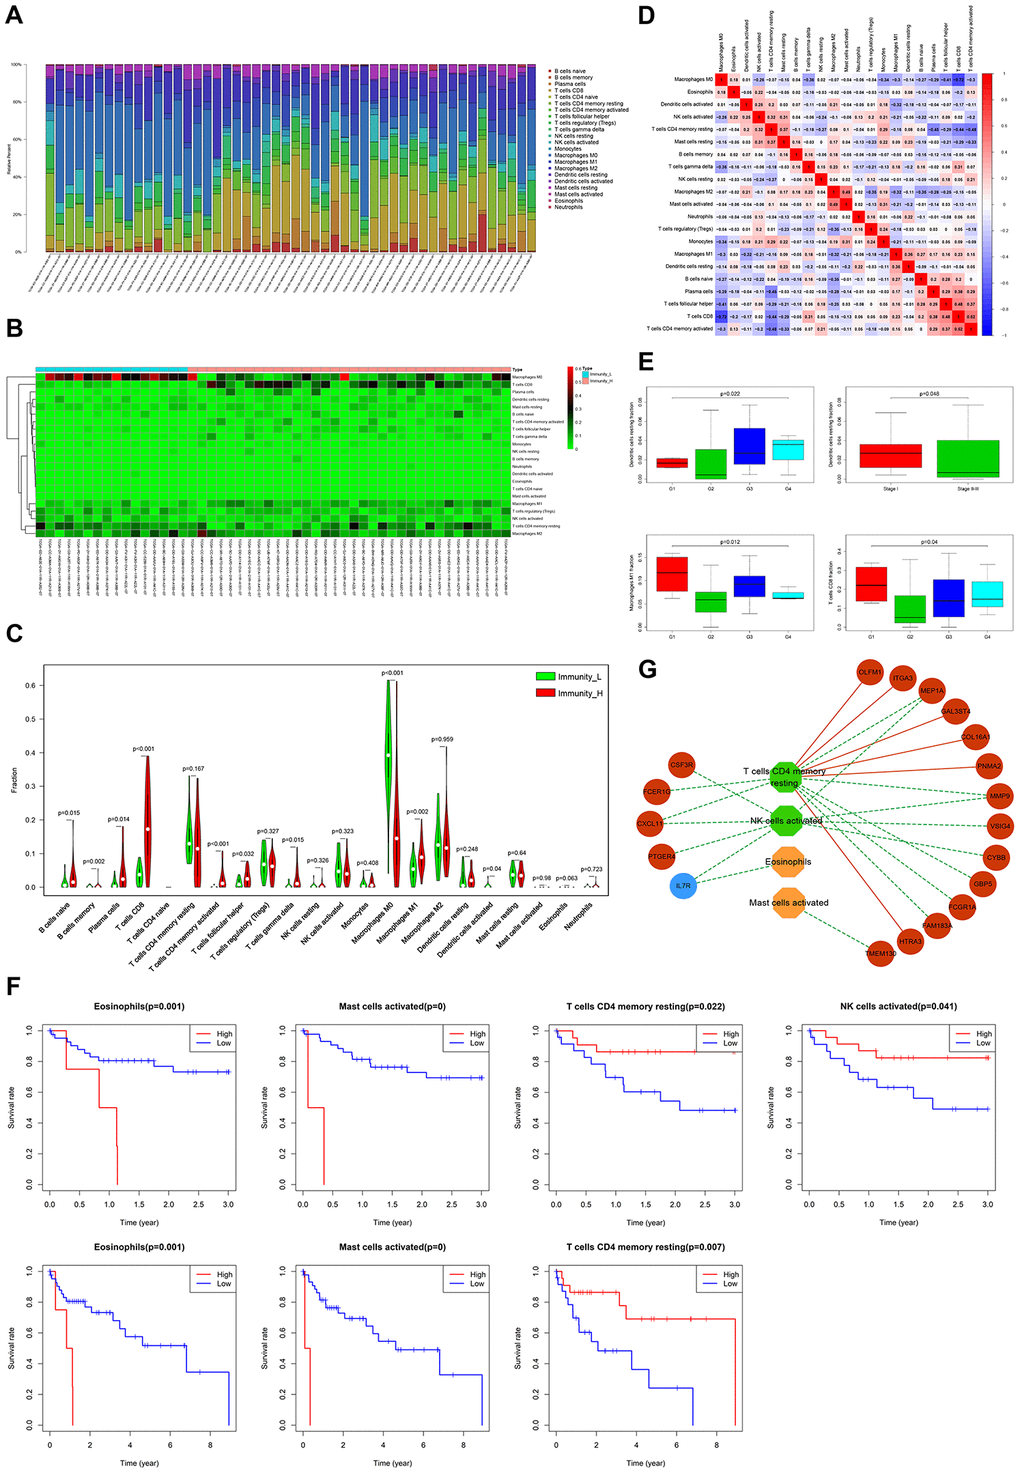
Figure 7.Evaluation of clinical outcomes based on differential TIICs. (A) Relative proportions of 22 immune cell subpopulations in HCC patients. (B) Heatmap visualization of differential immune cell proportions between Immunity_H and Immunity_L. (C) Violin plot analysis exhibiting distinct immune cells subpopulation between Immunity_H and Immunity_L. (D) Correlation matrix of all 22 immune cell proportions in HCC. (E) Box plot depicting relationships between TIICs and pathologic grade, as well as the clinical stage (Kruskal-Wallis tests). (F) Kaplan-Meier survival curves show the relationship between TIICs and survival. (G) The regulation networks among prognostic TIICs, IRG panel, and stromal cell content-related DEG panel. Green and blue represent protective factors. Red and orange represent the opposite.