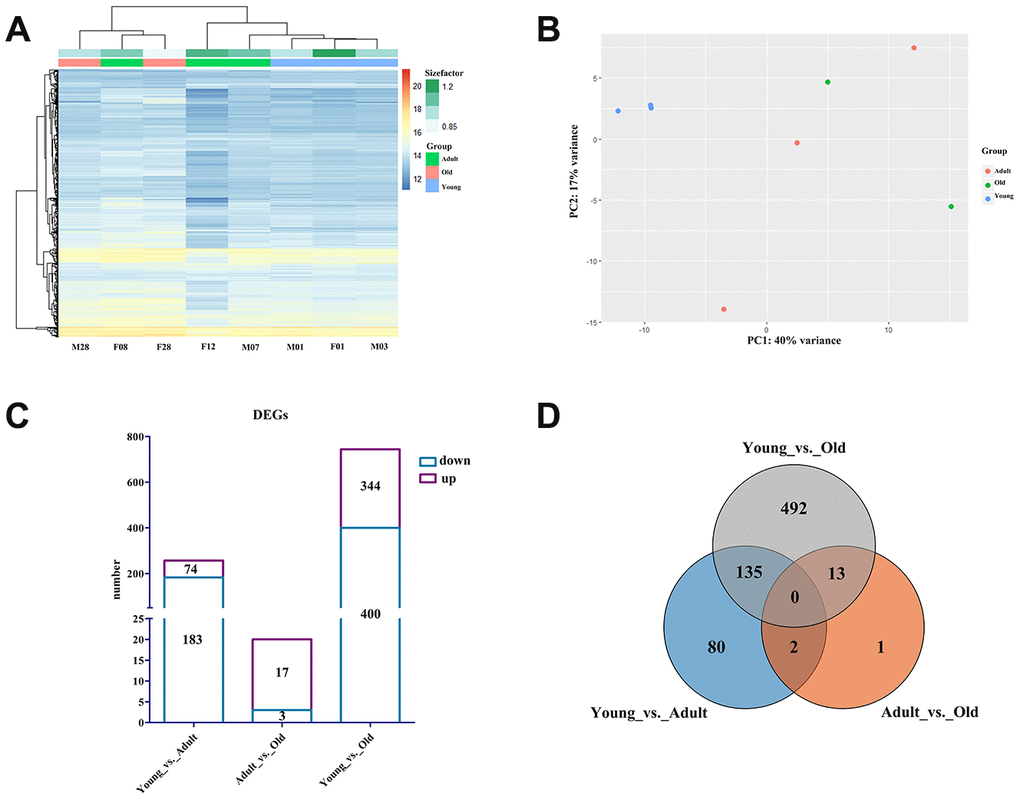
Figure 2.Profile of the giant panda blood transcriptome. (A) Heat map plot of all genes using TPM expression value of genes by adopting hierarchical clustering method. (B) PCA of all genes using TPM expression value of genes by adopting hierarchical clustering method. (C) The histogram of the number of DEGs in each group. The purple box represents the number of upregulated DEGs, and the blue box represents the number of downregulated DEGs. (D) Venn diagram of the number of annotated DEGs in each group.