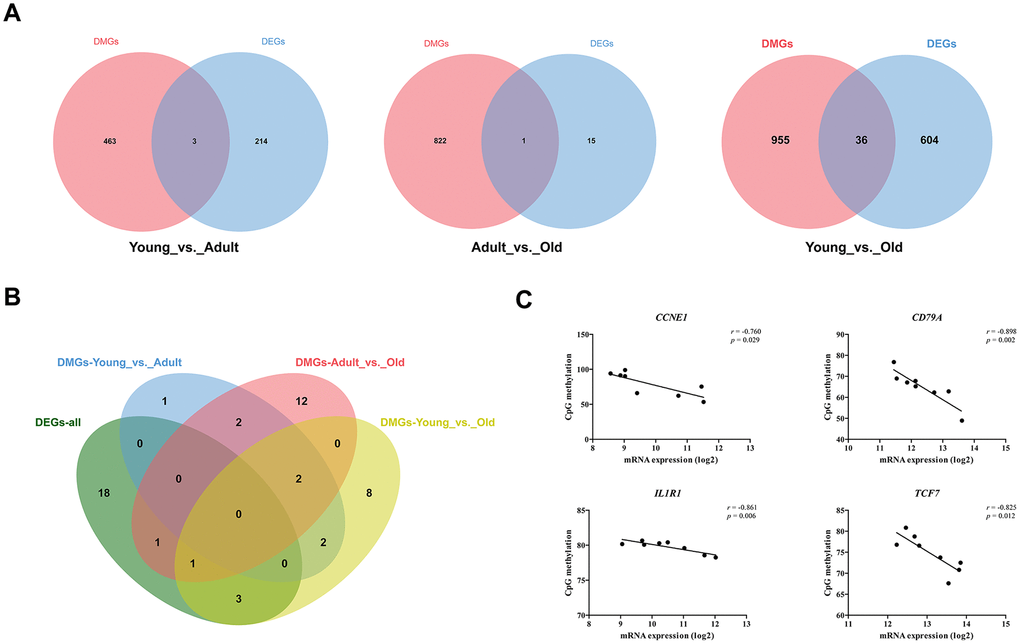
Figure 4.Combined analysis of transcriptome and methylation data. (A) Venn diagram of DEGs and DMGs in different groups. (B) Venn diagram of KEGG pathway significantly enriched by DEGs and DMGs. (C) A scatter plot and trend line (Pearson correlation) showing correlation between the log2 ratios of CCNE1, CD79A, IL1R1, and TCF7 expression from transcriptome and CpG methylation.