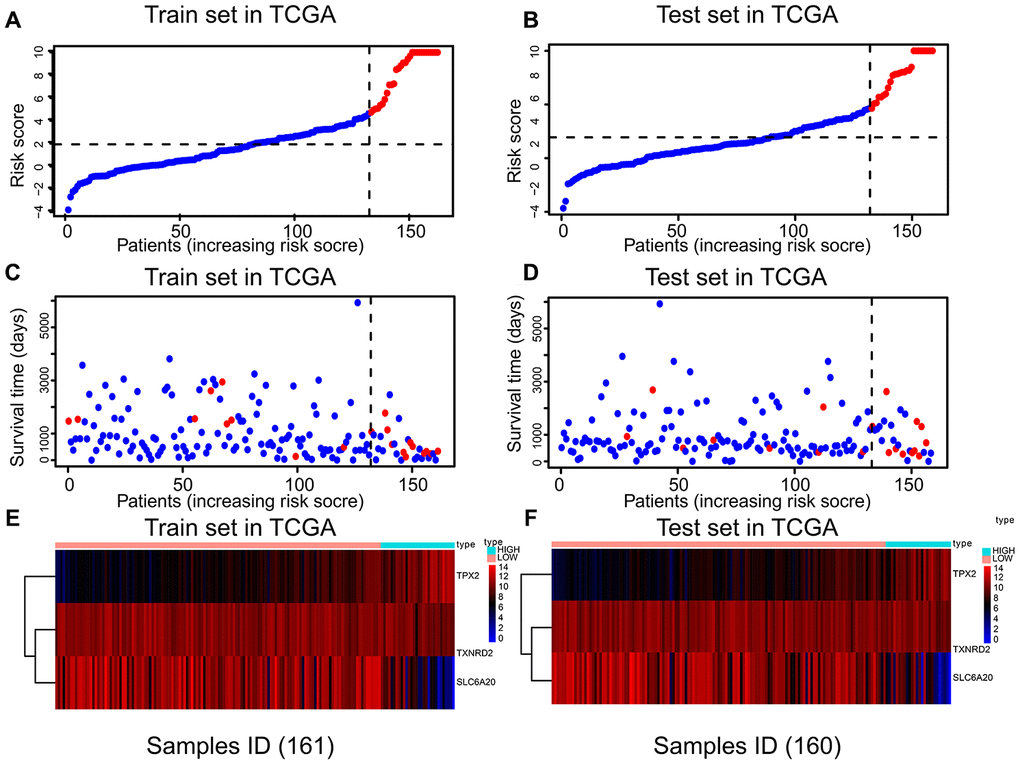
Figure 3.The relation between risk score, survival state, and risk factors in the training and test sets. There were three parts in training and test sets. The horizontal axis represents the same order of samples. (A, B) Parts A and B showing the risk score of each patient. (C, D) Parts C and D showing the survival state and risk score of each patient. (E, F) Parts E and F showing the expression levels of TPX2, TXNRD2 and SLC6A20.