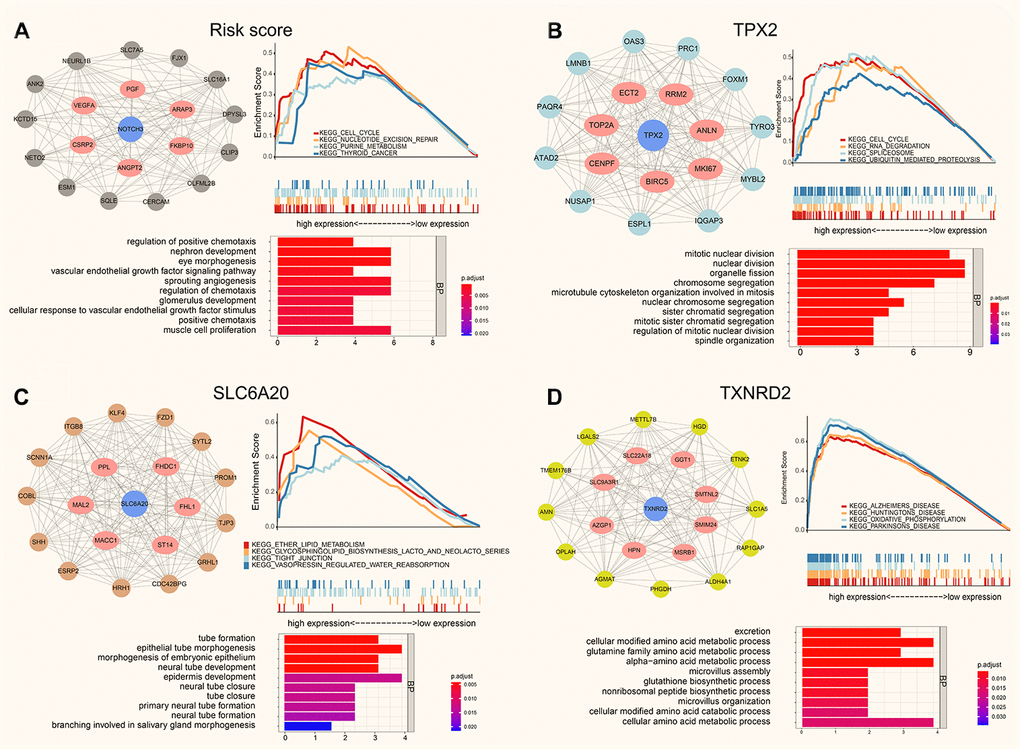
Figure 7.The protein-protein interaction network, function enrichment and GSEA analysis of co-expression modules (Pearson Cor > 0.4). (A) The risk score correlation genes in black module. (B) The co-expressed genes for TPX2 in turquoise module. (C) The co-expression genes for SLC6A20 in brown module. (D) The SLC6A20 co-expression genes in yellow module.