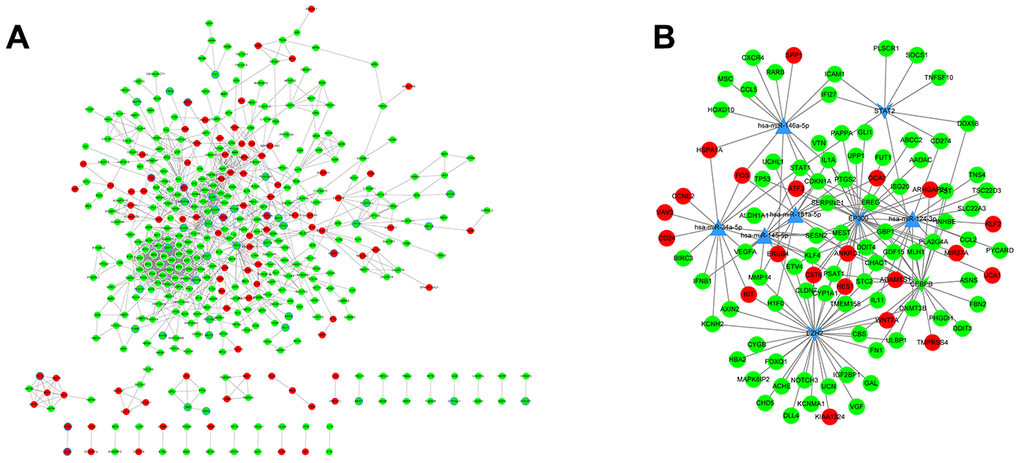
Figure 5.PPI analysis and miRNA regulatory networks. (A) PPI networks were constructed to visualize the relationships of differentially expressed genes screened from PC-knockdown samples compared to control samples. Red dots represent up-regulated genes and green dots refer to down-regulated genes. The points with a blue border refer to ovarian cancer-related genes. (B) miRNA regulatory network. A complex regulatory network was constructed to visualize connections of miRNAs, transcription factors, and genes related to ovarian cancer. The dots in red and green represent up- and down-regulated genes, respectively. Triangular nodes refer to miRNAs and v-shaped nodes represent transcription factors.