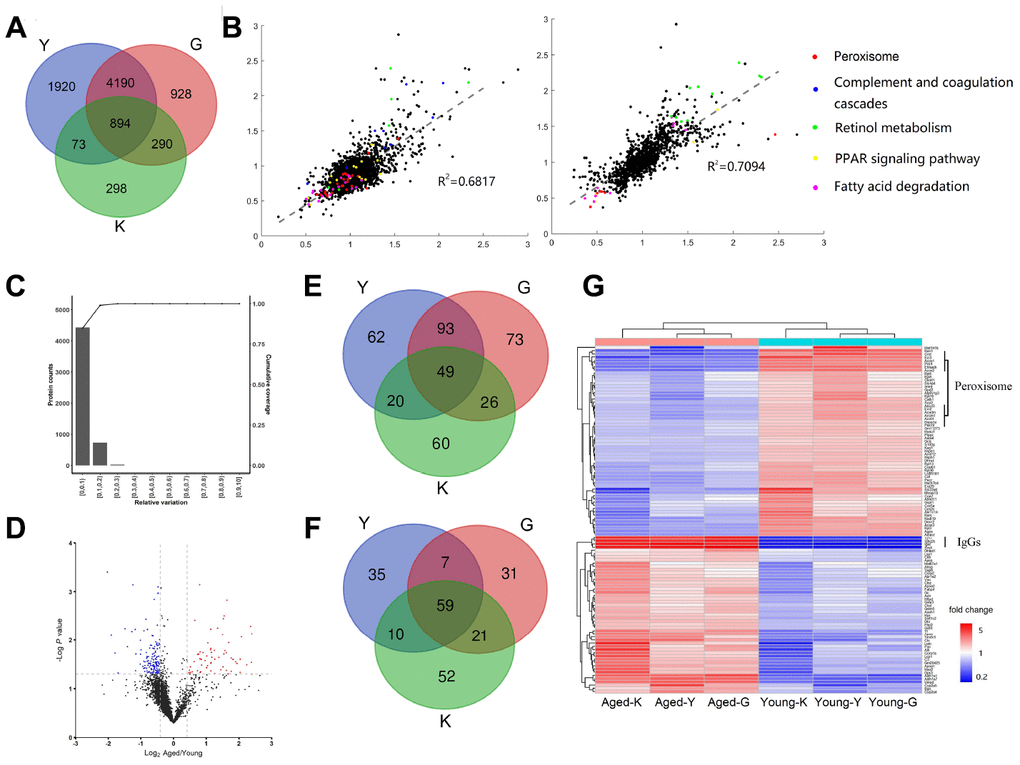
Figure 1.Differentially expressed proteins (DEPs) in young and aged mouse kidneys. (A) Comparison of three proteomic datasets: this study and (14, 16). (B) Scatter plots showing correlations between our data to G-dataset (left) and to K-dataset (right) (Red dot, Peroxisome; Blue dot, Complement and coagulation cascades; Green dot, Retinol metabolism; Yellow dot, PPAR signaling pathway; Pink dot, Fatty acid degradation). (C) Determination of the cut-off thresholds for DEPs. (D) Volcano diagram of DEPs between aged and young mouse kidneys. (E, F) Venn diagram comparing the up-regulated (E) and down-regulated (F) proteins in this study and (14, 16). (G) Hierarchical clustering of DEPs presented in all three datasets.