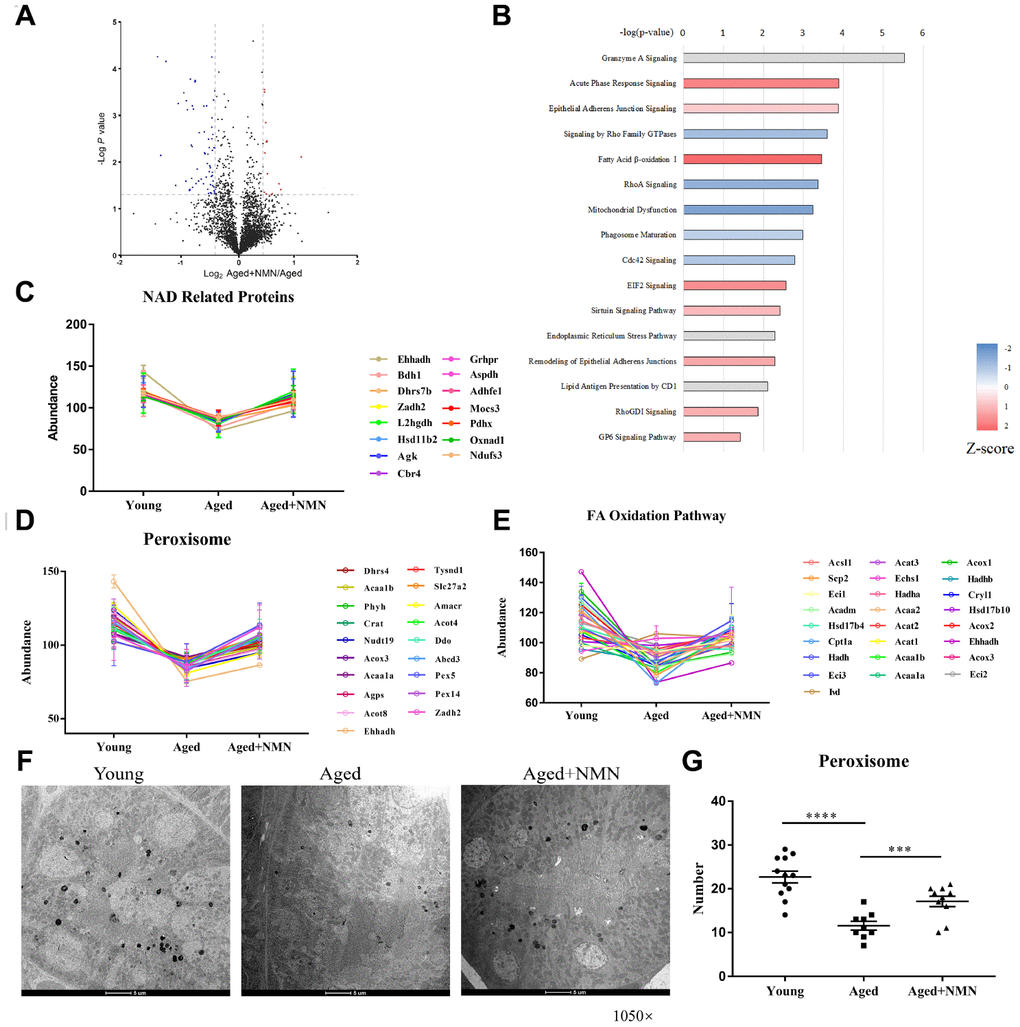
Figure 4.NMN restores proteostasis in aged kidneys. (A) Volcano plot of DEPs in untreated and NMN-treated kidneys. (B) IPA analysis of DEPs in untreated and NMN-treated kidneys (p < 0.05). (C) Expression of NAD-dependent oxidoreductase. (D–E) Expression of proteins associated with peroxisomes (D) and fatty acid oxidation pathways (E). (F) Electron micrograph showing part of the mouse kidneys stained for catalase by DAB. The electron-dense reaction product of DAB is observed in the matrix of all peroxisomes, while mitochondria and other components of the cytoplasm are not stained. (Mag. ×1,050). (G) The number of peroxisomes in young, aged and NMN-treated kidneys based on electron micrographs. Data were analyzed using Student’s t-test. *p < 0.05, **p < 0.01, and ***p < 0.001. p < 0.05 was considered statistically significant. Error bars represent ± SEM.