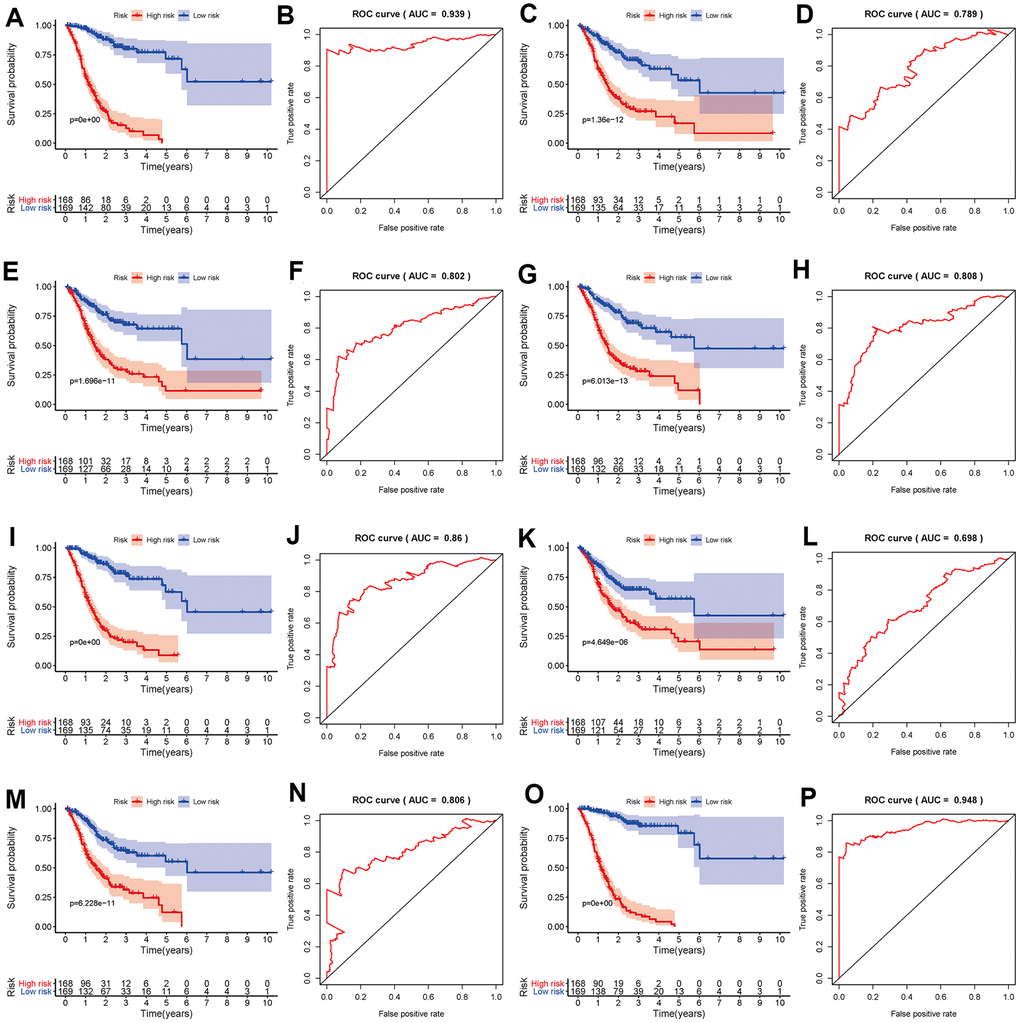
Figure 5.Kaplan-Meier and ROC curves of prognostic predictors in the GC cohort. Kaplan-Meier plot of the survival probability over time for prognostic predictors based on AA (A), AD (C), AP (E), AT (G), ES (I), ME (K) and RI (M) events with high (red) and low (blue) risk groups, respectively. ROC analysis for prognostic predictors based on AA (B), AD (D), AP (F), AT (H), ES (J), ME (L) and RI (N) events. (O) Kaplan-Meier plot depicting the survival probability over time for the final prognostic predictor with high (red) and low (blue) risk groups. (P) ROC analysis for the final prognostic predictor based on all seven types of AS events.