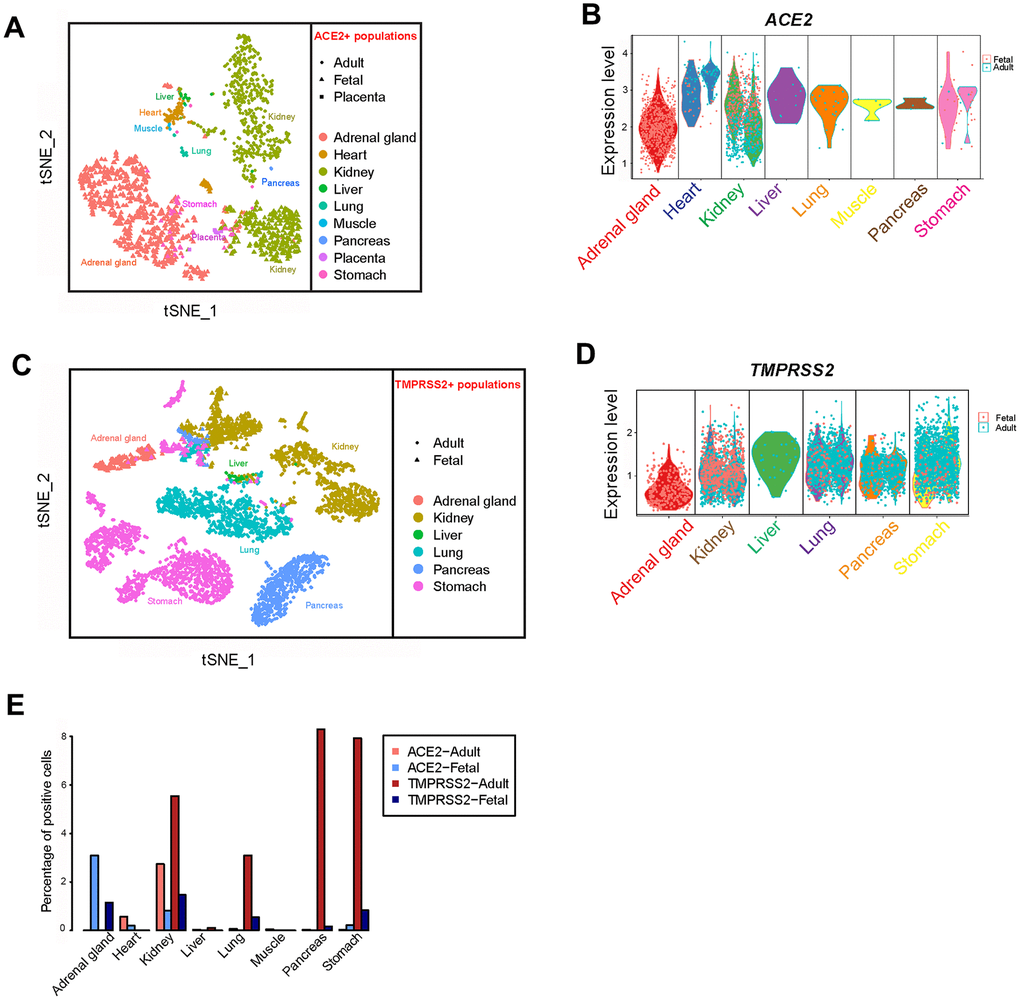
Figure 2.Profiling of ACE2- and TMPRSS2-positive cells in different tissues. (A) t-distributed stochastic neighbor embedding (TSNE) plot of ACE2-positive cells. Cells from the merged adult, fetal and placenta groups are indicated by different dot shapes. (B) Violin plot of ACE2 expression in different tissues from the adult and fetal groups. (C) TSNE plot of TMPRSS2-positive cells. Cells from the merged adult, fetal and placenta groups are indicated by different dot shapes. (D) Violin plot of TMPRSS2 expression in different tissues from the adult and fetal groups. (E) Bar plot showing the percentage of cells expressing ACE2 and TMPRSS2 in the adult and fetal groups.