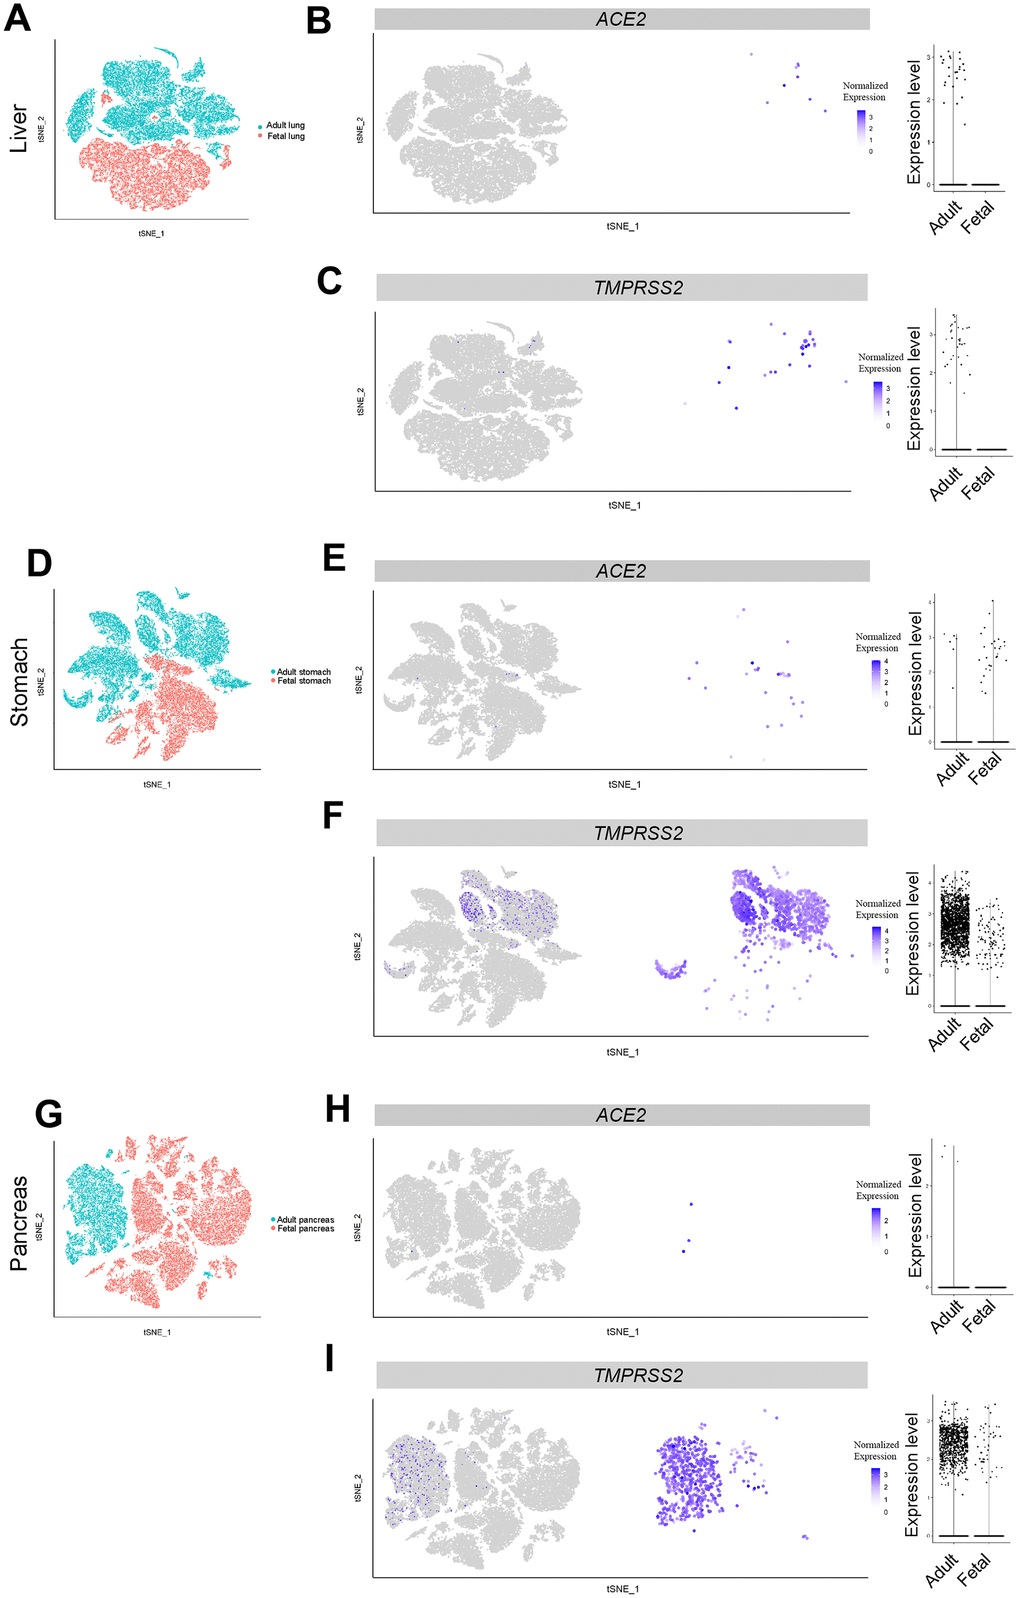
Figure 3.Single-cell analysis of liver, pancreas and stomach. (A) t-distributed stochastic neighbor embedding (TSNE) plot showing sub-clusters of liver cells, (B) ACE2 and (C) TMPRSS2 expression in liver from the adult and fetal groups. (D) TSNE plot showing sub-clusters of stomach cells, (E) ACE2 and (F) TMPRSS2 expression in stomach from the adult and fetal groups. (G) TSNE plot showing sub-clusters of pancreas cells, (H) ACE2 and (I) TMPRSS2 expression in pancreas from the adult and fetal groups.