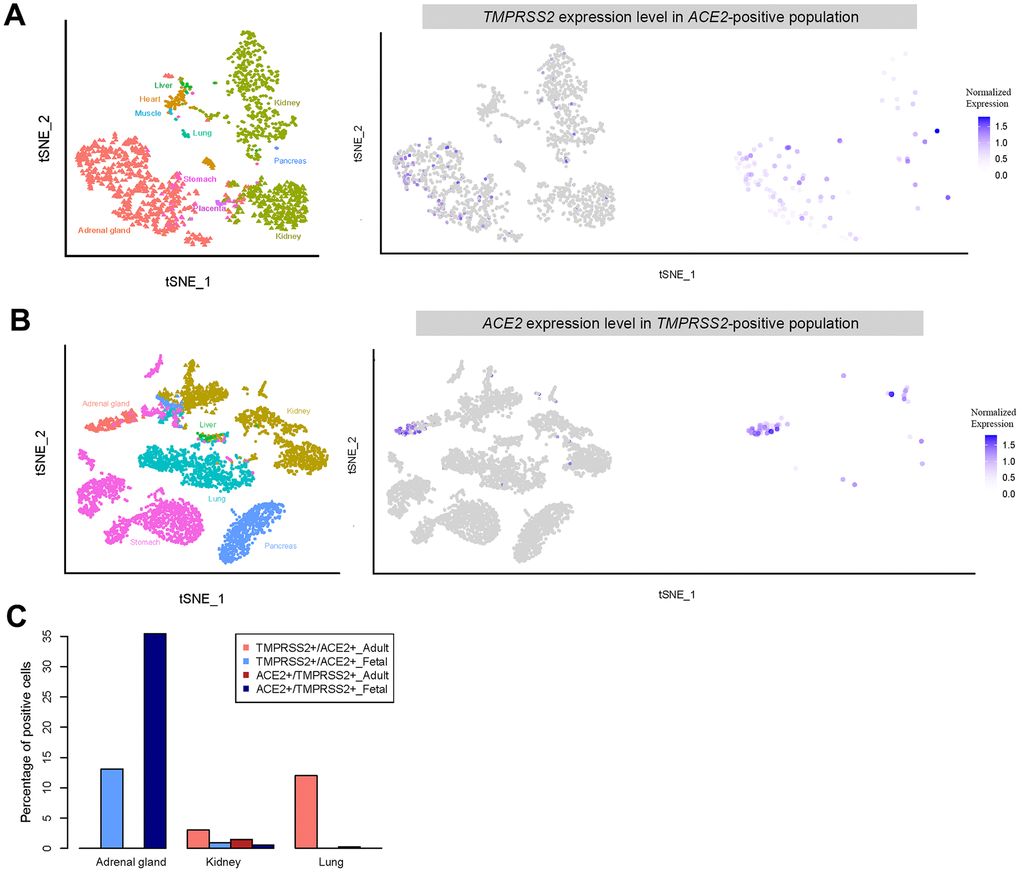
Figure 6.Expression of double positive (ACE2- and TMPRSS2- positive) and single positive (ACE2- or TMPRSS2- positive) cells. (A) t-distributed stochastic neighbor embedding (TSNE) plot displaying TMPRSS2 expression in ACE2-positive cells. (B) TSNE plot showing ACE2 expression in TMPRSS2-positive cells. (C) Percentage of double positive cells in each single positive population for the different tissues.