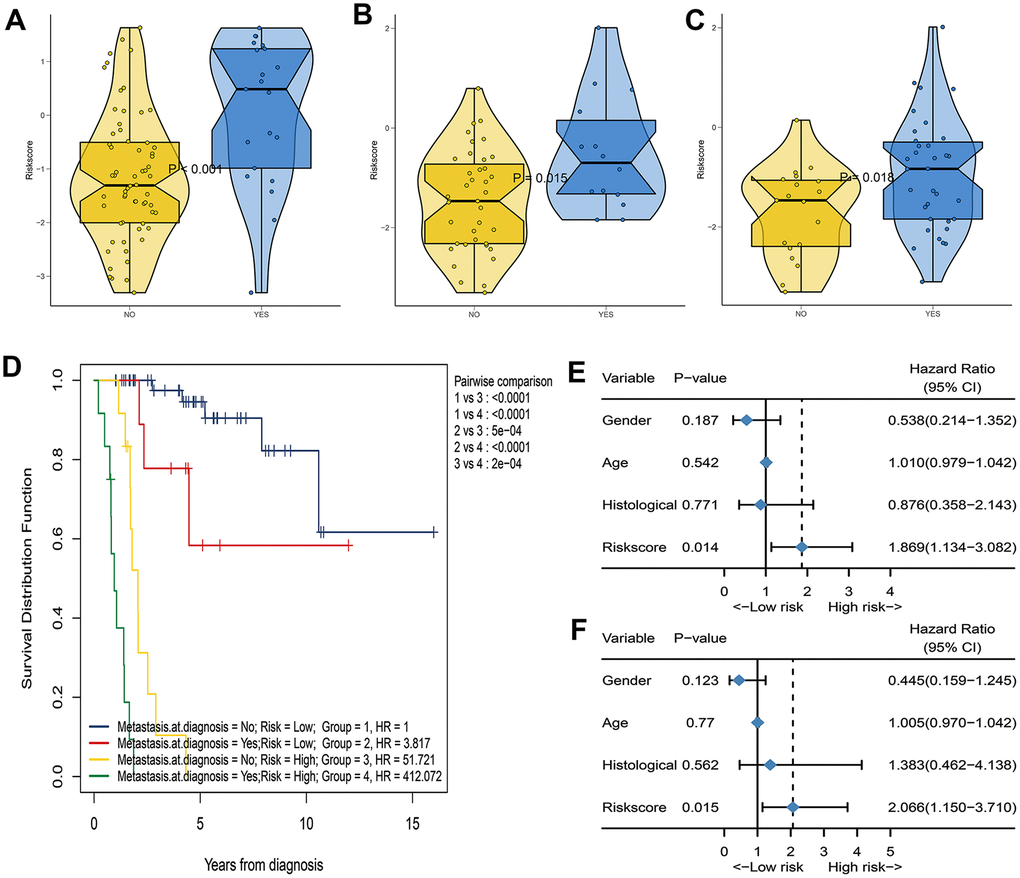
Figure 4.Assess the correlation between IRGP signature and metastasis status. (A) Box violin plot of the relationship between the metastasis status at diagnosis and the IRGP signature value in the TCGA cohort. (B) Box violin plot of the relationship between the metastasis status at diagnosis and the IRGP signature value in the GSE21257 cohort. (C) Box violin plot of the relationship between the metastasis status within 5 years and the IRGP signature value in the GSE21257 cohort. (C) Kaplan–Meier curves of overall survival for patients in TCGA cohort stratified by both IRGP signature, and metastasis status. (D) Forest plot of univariate Cox regression results between various variables and tumor metastasis in the GSE21257 cohort. (E) Forest plot of univariate Cox regression results between various variables and tumor metastasis in the GSE21257 cohort. (F) Forest plot of multivariate Cox regression results between various variables and tumor metastasis in the GSE21257 cohort.