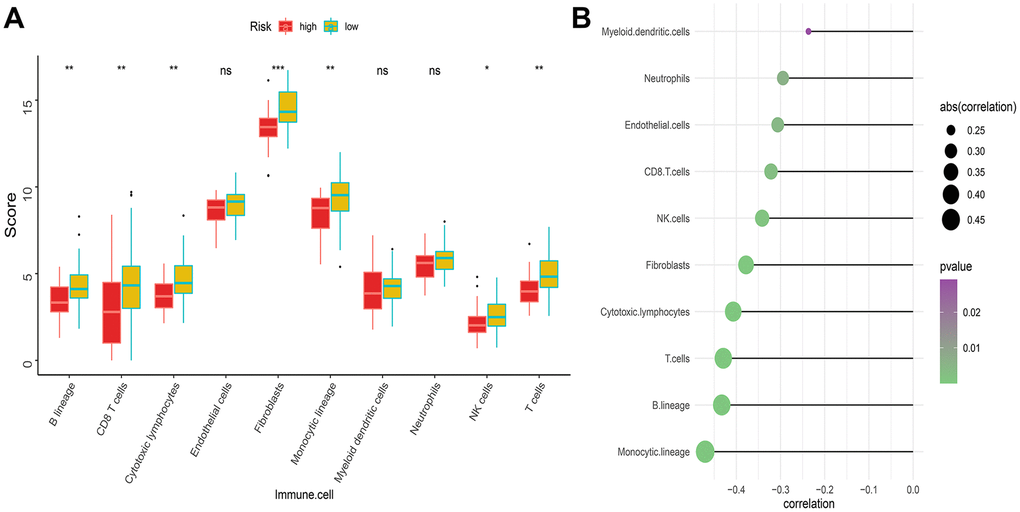
Figure 6.Difference of immune infiltration among patients in IRGP signature group. (A) Box plot showing the absolute abundance scores of 10 immune cell and stromal cell populations in two groups of patients. (B) Correlation matrix between absolute abundance scores of immune cells and stromal cells and IRGP values. The size of the bubble represents the degree of correlation and the color of the bubble represents the p-value of the correlation. (ns represents no significance, *P < 0.05, **P < 0.01, ***P < 0.001).