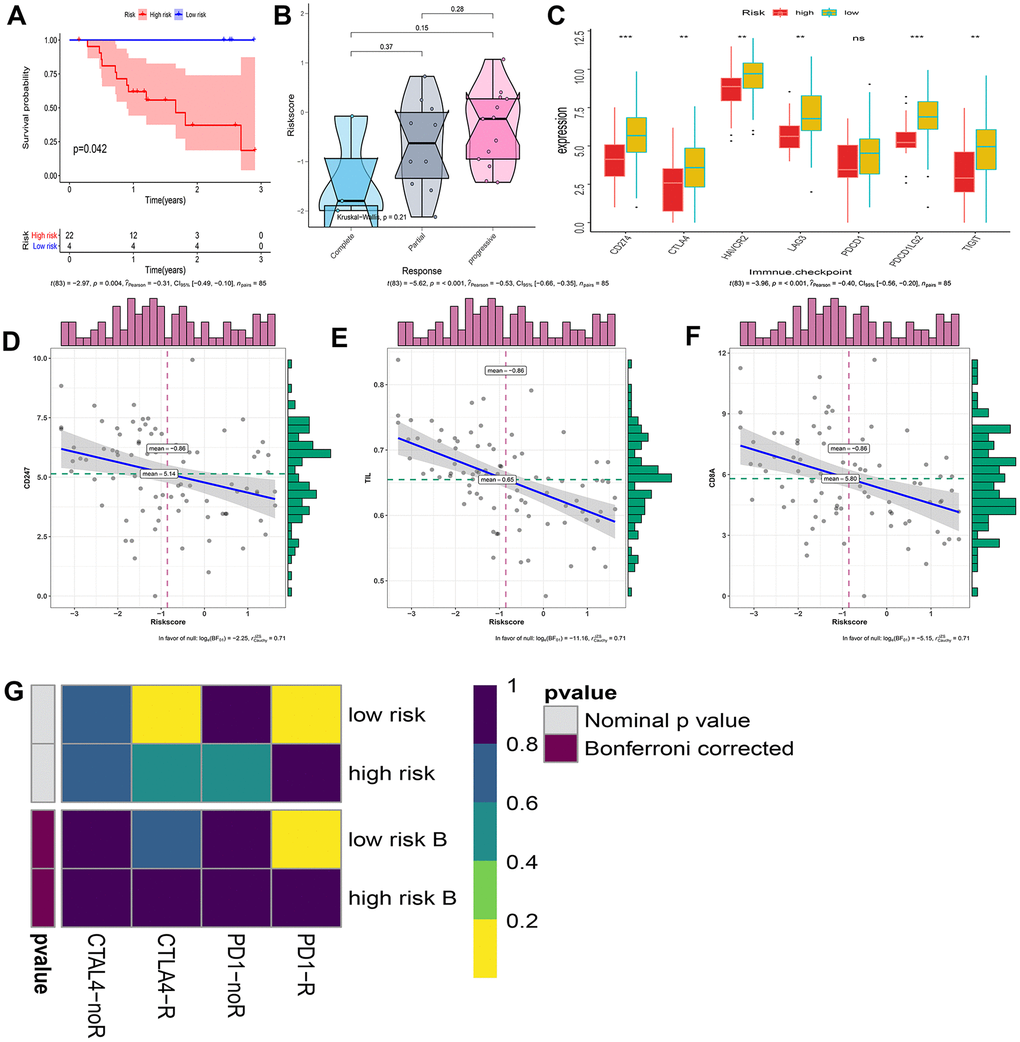
Figure 8.Explore patients who may hope to benefit from immunotherapy. (A) Kaplan–Meier curves of overall survival according to IRGP groups in GSE78220. (B) Box violin plot of the relationship between the immunotherapy response and the IRGP signature value in the GSE78220 cohort. (C) Box plot showing the expression of 7 immune checkpoint genes in two groups of patients. (D) Correlation between IRGP value and CD247 gene expression. (E) Correlation between IRGP value and TIL. (F) Correlation between IRGP value and CD8A gene expression. (G) Heatmap of correlation between expression profiles of patients in the IRGP group and patients receiving immunotherapy. The color of the grid represents the correlation P-value.