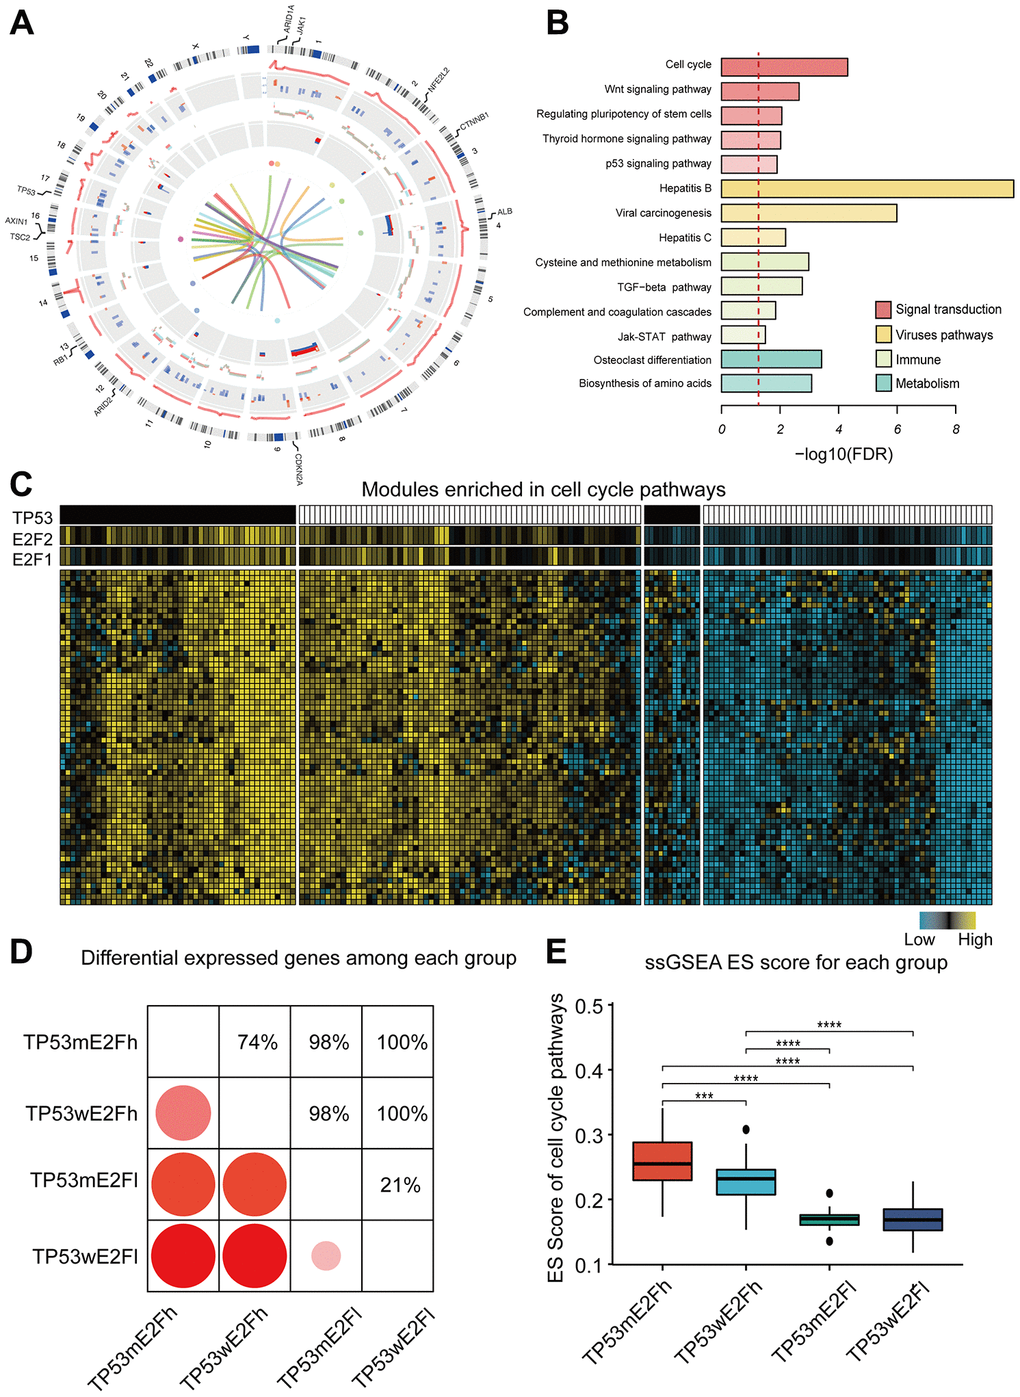
Figure 2.Functions and characteristics of HCC drivers. (A) Circos plot shows the alterations of 384 drivers. Circular tracks from outside to inside: regulation score, mRNA fold-change, copy number alteration, DNA methylation status, mutations, and protein interactions. The outermost labels indicate the significant mutated genes. Red represents high expression/methylation and CNV gain; blue represents low expression/methylation and CNV loss. Sex chromosomes are excluded. (B) Enriched KEGG pathways of the drivers; the dotted line indicates FDR=0.05. (C) Example of a co-expression module and its predicted regulators. Genes in this module are enriched in cell cycle pathway. HCC tissues were classified into four subgroups based on the combined alterations of E2F expression and TP53 mutation. (D) Comparison of the number of differentially expressed genes between any two subgroups. Only genes in the example module were used. (E) Comparison of the activity of cell cycle pathway among the four subgroups. ssGSEA was performed for each tumor using the genes in cell cycle pathway. Enrichment score (ES) represents the activity level of the pathway. TP53m and TP53w mean TP53 mutation and TP53 wildtype; E2Fh and E2Fl mean high and low expression of E2F. P value was determined by Wilcoxon rank sum test. ****P < 0.0001; ***P < 0.001; **P < 0.01;*P < 0.05.