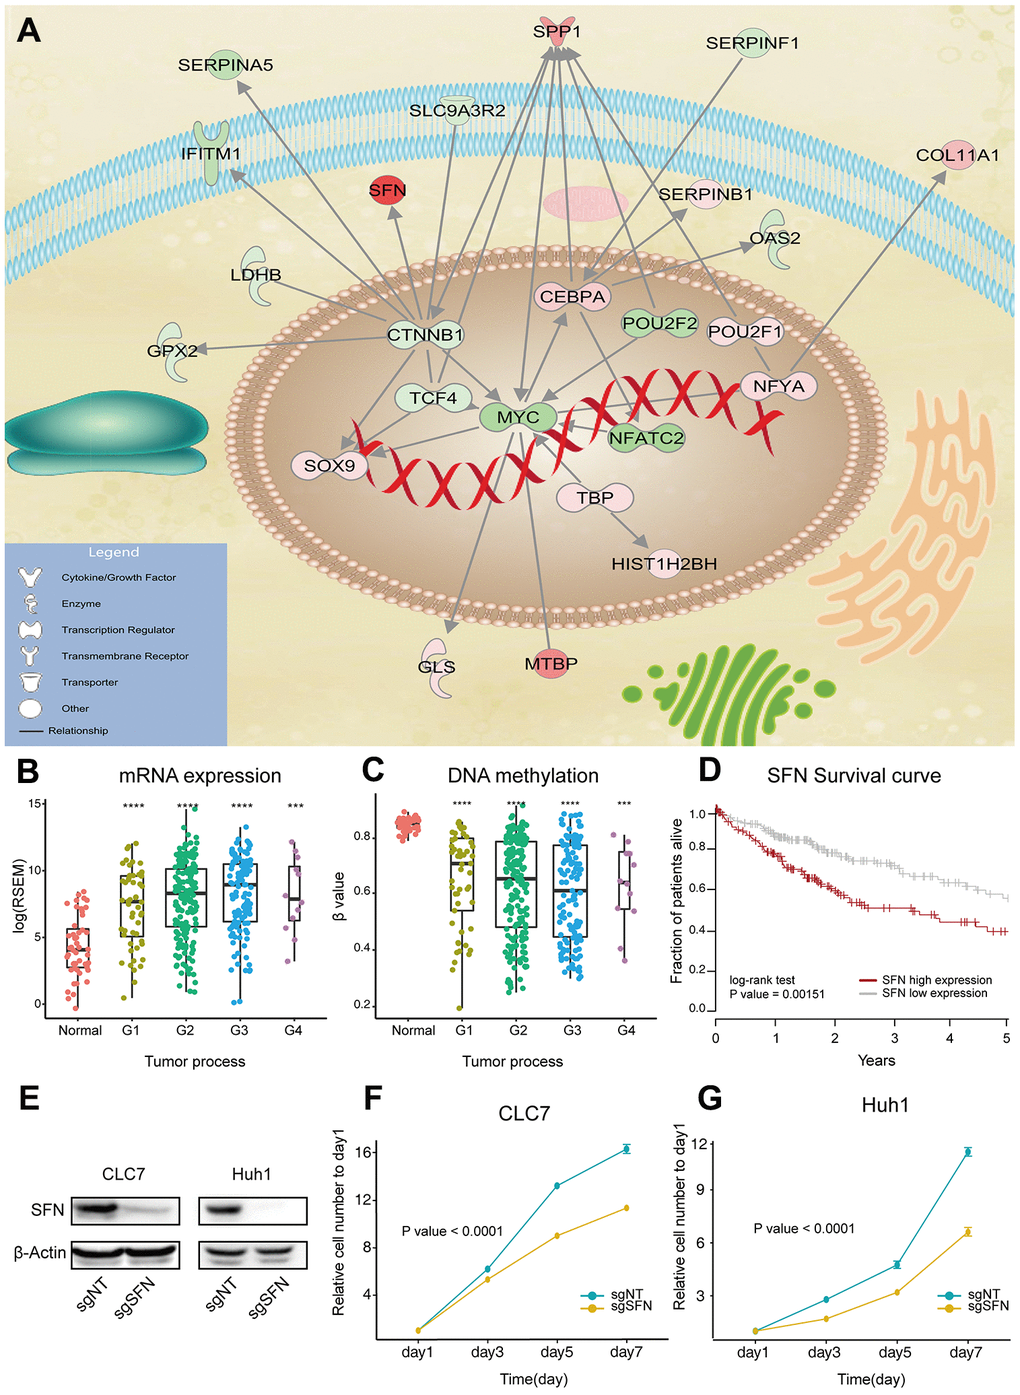
Figure 3.SFN functions as oncogene in HCC. (A) Max regulatory network of drivers, generated by IPA analysis. Edges represent direct regulatory relationships obtained from literature. Red and green nodes represent genes that are increased and decreased in HCC, respectively. (B, C) SFN expression and methylation correlate with HCC progression. P value was determined by Wilcoxon rank sum test: ****P < 0.0001; ***P < 0.001; **P < 0.01; **P < 0.01. (D) Survival of HCC patients with high and low SFN expression. (E) SFN protein levels analyzed by western blotting in SFN knockout cells. (F, G) Proliferation of CLC7 and Huh1 cells transfected with sgRNAs targeting SFN (n=3, regression analysis).