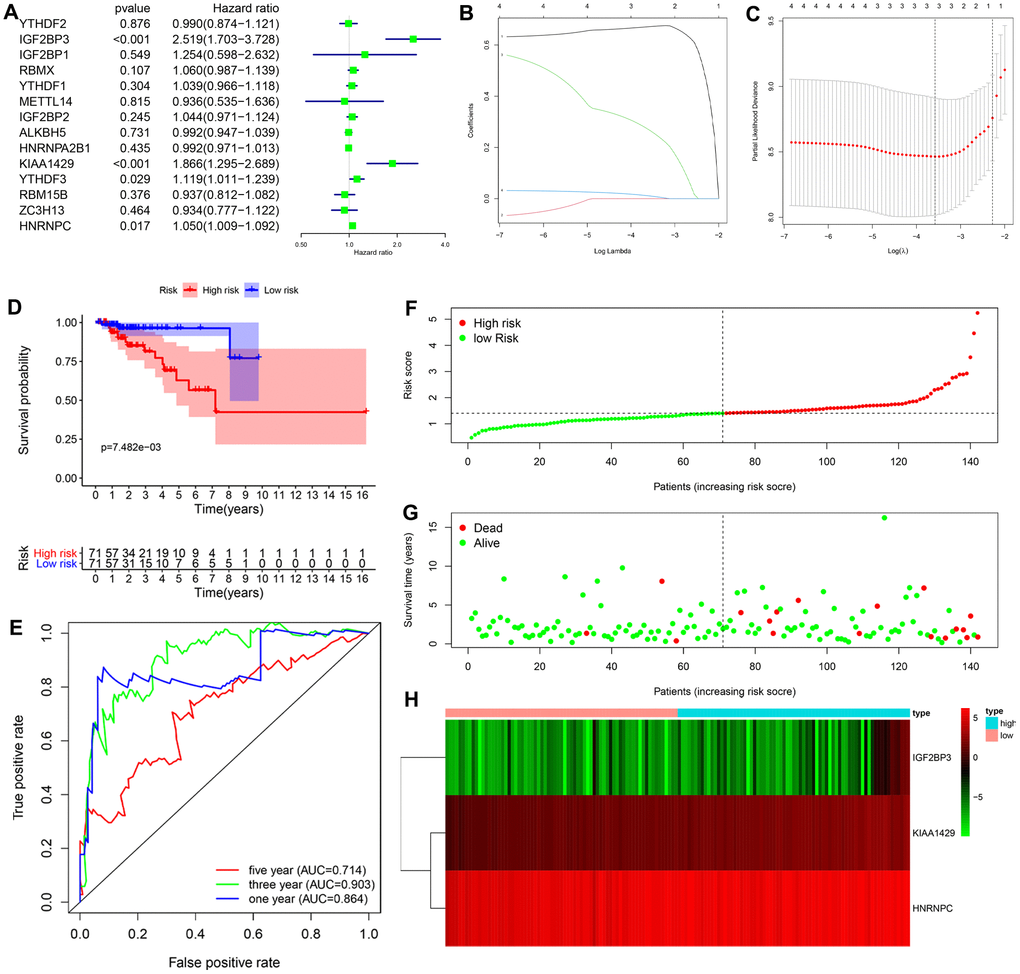
Figure 3.Construction and evaluation of the 3-gene prognostic risk signature in the training cohort of KIRP patients. (A) Univariate Cox regression analysis results show the p values and hazard ratios (HR) with confidence intervals (CI) of the 14 differentially expressed m6A RNA methylation regulatory genes. (B, C) LASSO Cox regression analysis results show the identification of the 3 prognostic risk signature genes. (D) Kaplan-Meier survival curves show the overall survival (OS) rates of high-risk (n=71) and low-risk (n=71) KIRP patients of the training cohort. The high-risk group shows shorter OS compared to the low-risk group. (E) ROC curve analysis results show the accuracy and reliability of the prognostic risk signature in determining the 1-year, 3-year, and 5-year survival outcomes of the high- and low-risk KIRP patients in the training cohort. The AUC values are shown in parenthesis. (F) The risk score distribution of the high-risk (red) and low-risk (green) KIRP patients in the training cohort. (G) The distributions of training cohort patients based on their survival times and risk scores. The red dots represent patients that have died, whereas, the green dots denote patients that are alive at the time of analysis. (H) The heatmap shows the expression levels of the three prognostic risk-related m6A RNA methylation regulators in the high-risk (blue) and low-risk (pink) KIRP patients of the training cohort.