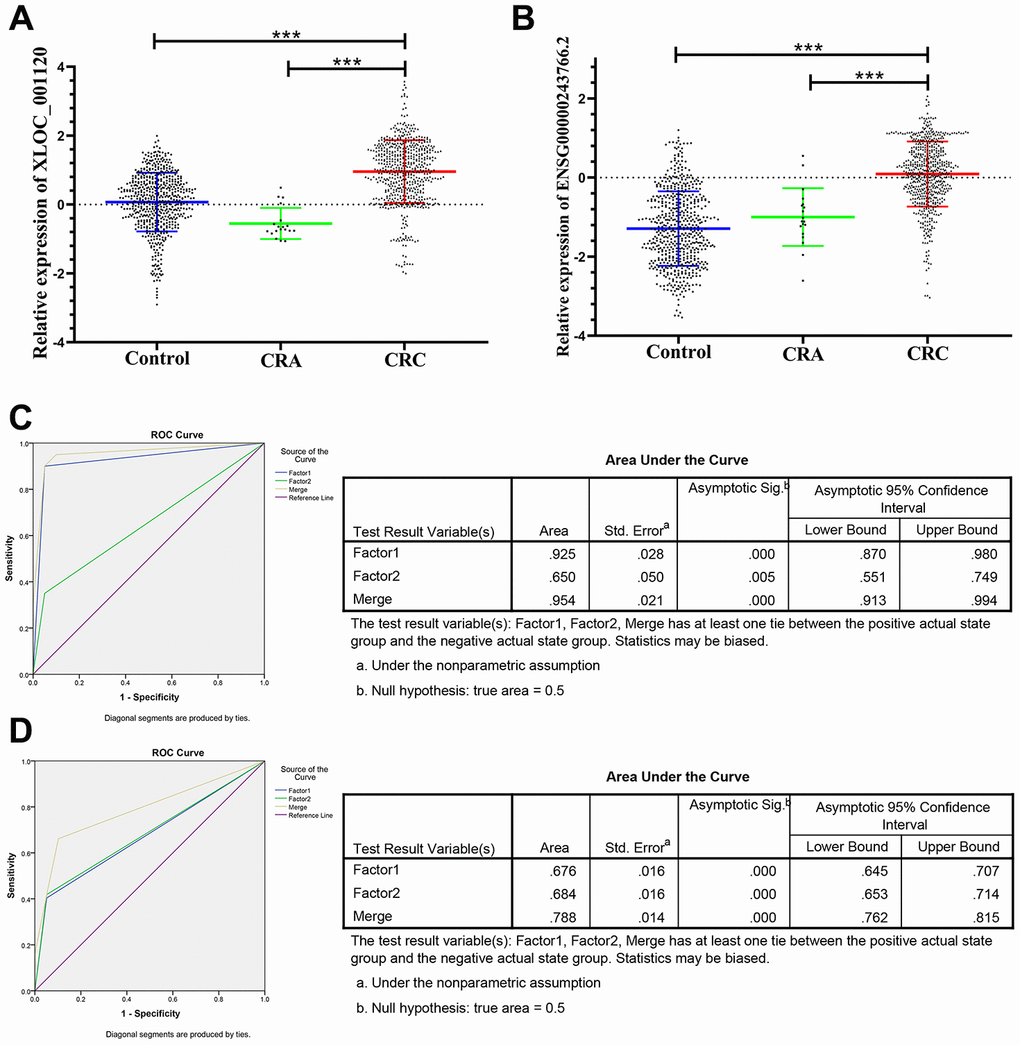
Figure 4.Relative expression of 2 lncRNAs in HC, CRA and CRC, and ROC curve analysis for predicting the 2 lncRNAs as CRC diagnosis biomarkers. (A–B) qRT-PCR analysis was used to detect the expression of XLOC_001120 and ENSG00000243766.2 in 585 plasma samples from healthy controls, 19 samples of CRA patients and 597 plasma samples from CRC patients. Data was log-transformed and was presented as mean ± SD. Data was analyzed with student t test. “***” indicated p < 0.001. (C) ROC curve for the 2-lncRNA signature to separate 60 CRC cases from 60 controls in the training set with the AUC presented in the right. (D) ROC curve analysis was used for the 2-lncRNA signature to differentiate 597 CRC cases from 585 controls in the validation set with the AUC presented in the right. Factor1, 2 and merged represented the XLOC_001120, ENSG00000243766.2 and the combination of the 2 lncRNAs.