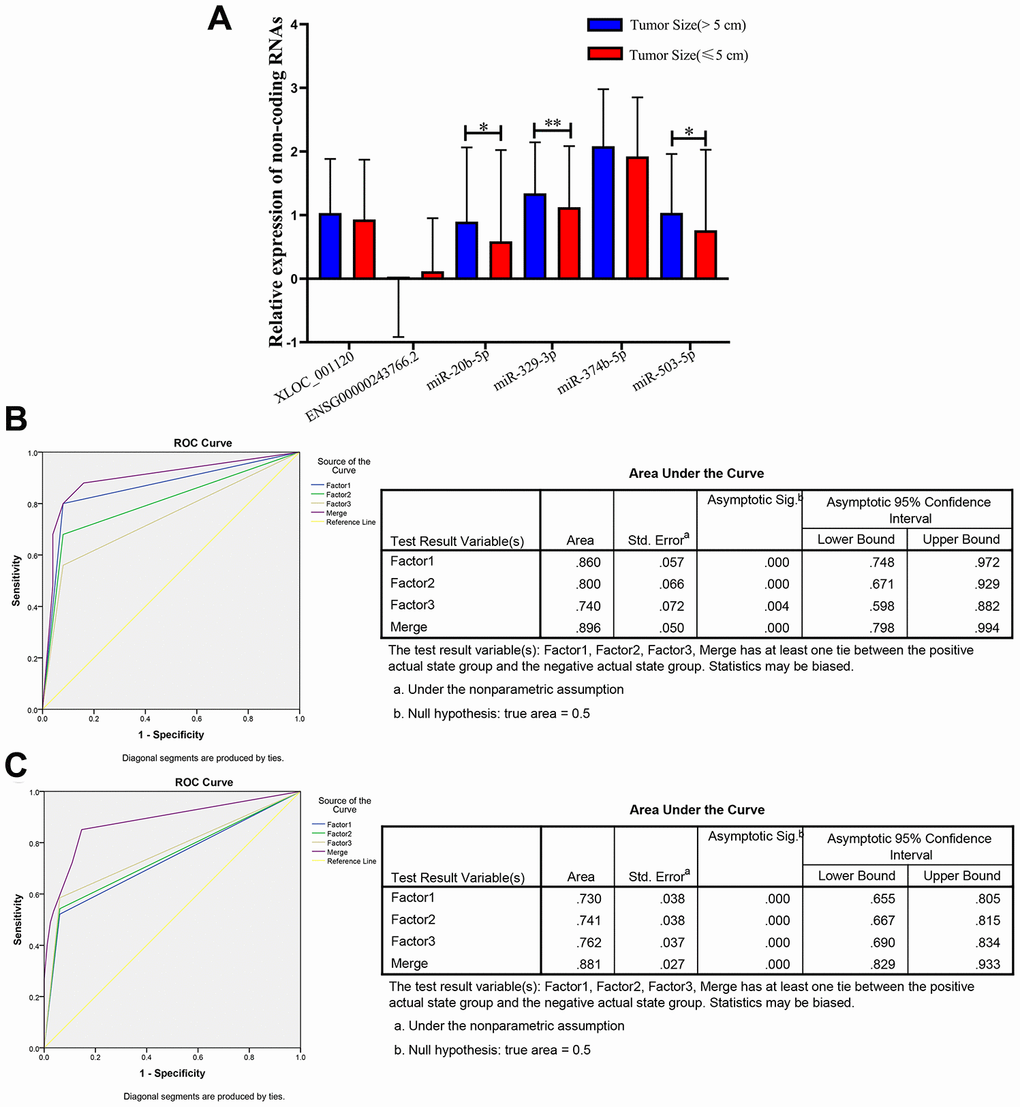
Figure 6.Relative expression of 6 non-coding RNAs in different tumor size of CRC, ROC curve analysis for predicting 3 microRNAs as a CRC tumor size biomarker. (A) qRT-PCR analysis was used to detect the expression of XLOC_001120, ENSG00000243766.2, miR-20b-5p, miR-329-3p, miR-374b-5p and miR-503-5p in 170 plasma samples from larger size (size>5cm) CRC patients and 427 smaller size (size≤5cm) CRC patients. Data was log-transformed and was presented as mean ± SD. Data was analyzed with student t test. “*” indicated p < 0.05, “**” indicated p < 0.01. (B) ROC curve analysis was conducted to discriminate between larger size group and smaller size group by the 3-microRNA profile. ROC curve analysis was performed for the 3-microRNA signature to separate 25 pairs in the training set with the AUC presented in the right. (C) ROC curve analysis was used for the 3-microRNA signature to differentiate 94 larger size CRC cases from 82 smaller size CRC group in the validation set with the AUC presented in the right. Factor1, 2, 3 and merged represented the miR-20b-5p, miR-329-3p, miR-503-5p and the combination of the 3 microRNAs.