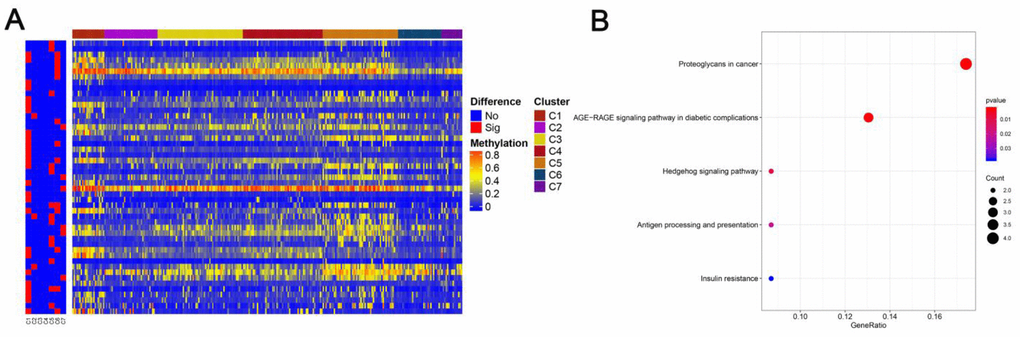
Figure 5.Specific methylation CpG sites for each DNA methylation cluster. (A) Specific CpG sites are shown for each DNA methylation prognosis subtype. Red bars represent specific CpG sites with significant differences. (B) KEGG pathway enrichment analysis of specific CpG sites.