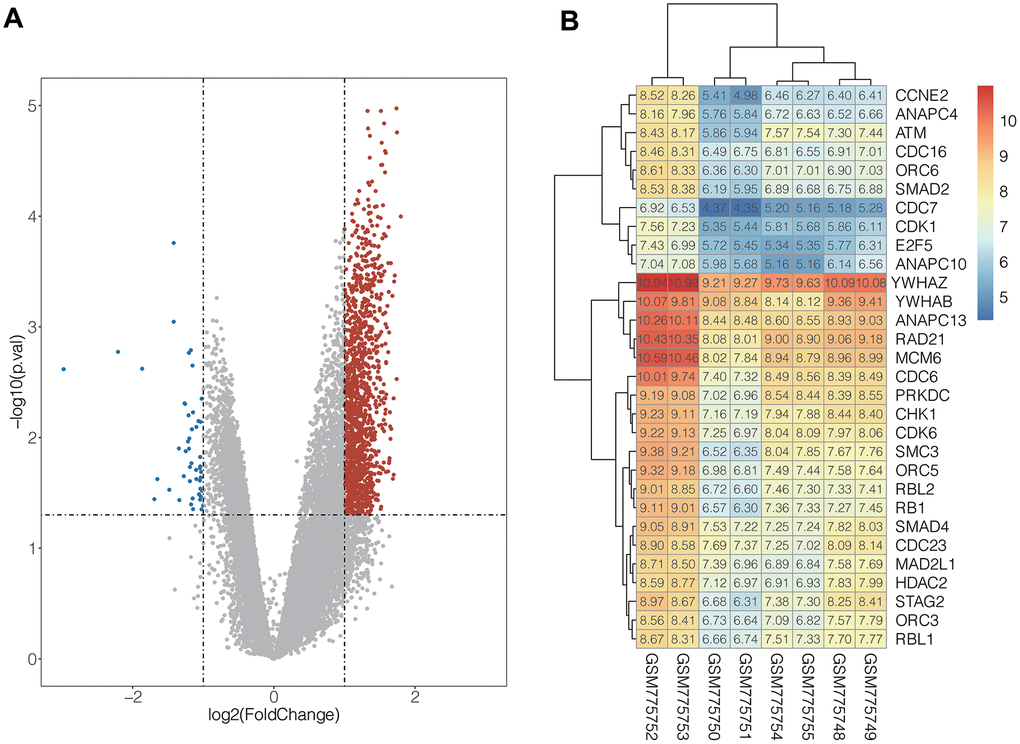
Figure 1. (A) Volcanic map of DEGs distribution. The abscissa of volcano map is the logarithmic value of the fold change (FC) of each sample, and the ordinate is the logarithm of 10 corresponding to the P value of the corresponding sample Negative values, the red and blue dots respectively represent genes that are up-regulated and down-regulated, and the grey dots represent genes that are not significantly different. (B) The expression heat map of the genes in cell cycle pathway. Red represents high gene expression and blue represents low gene expression.