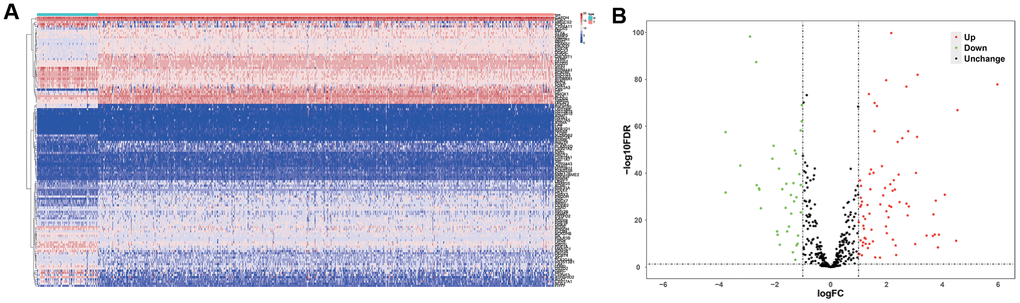
Figure 2.Differentially expressed metabolic genes in ccRCC samples. (A) The heat map shows the expression of 124 differentially expressed metabolic genes in ccRCC and normal renal tissue samples. (B) The volcano plot shows the upregulated or downregulated metabolic genes in the ccRCC samples relative to normal renal tissue samples.