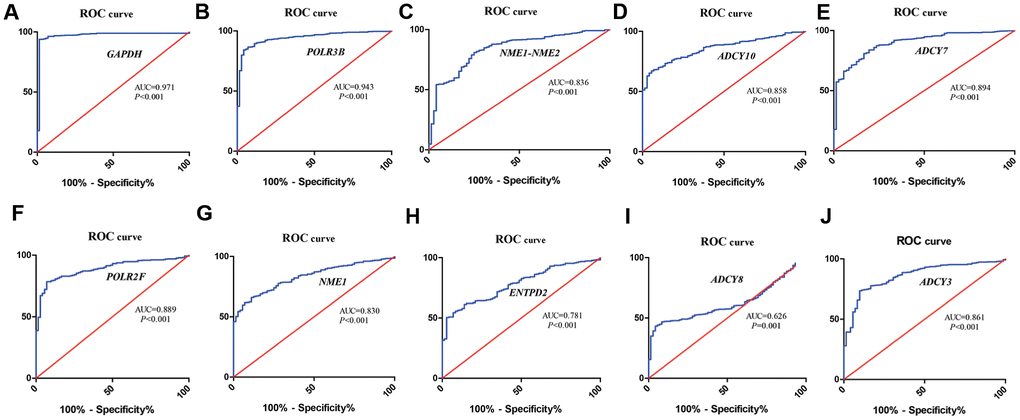
Figure 4.ROC curve analysis of hub metabolic genes. The figure shows the ROC curves evaluating the diagnostic accuracy of the 10 hub metabolic genes, namely, (A) GAPDH; (B) POLR3B; (C) NME1-NME2; (D) ADCY10; (E) ADCY7; (F) POLR2F; (G) NME1; (H) ENTPD2; (I) ADCY8; (J) ADCY3 in ccRCC patients.