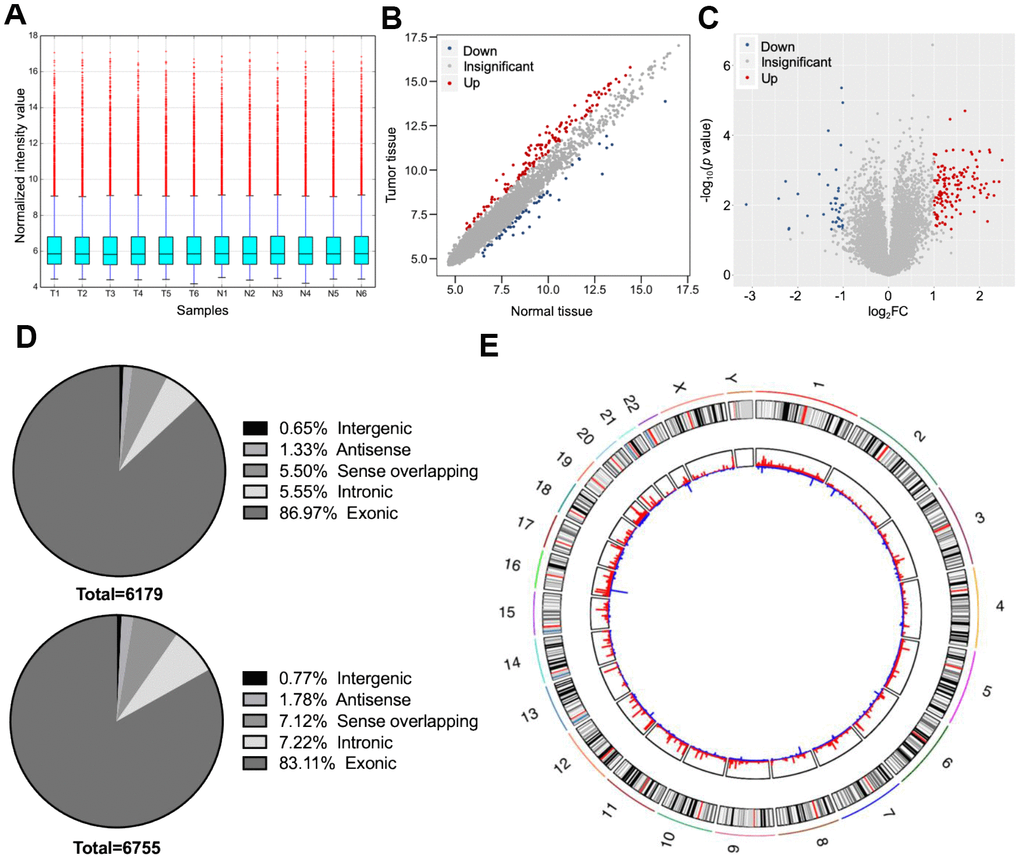
Figure 2.Overall characteristics of circular (circ)RNA expression profiling of distal cholangiocarcinoma (dCCA). (A) The distributions of circRNA expression values after quantile normalization and log2 processing. (T: dCCA tissues; N: paired adjacent normal tissues). (B) The scatter plot describing the difference of circRNA levels between dCCA and normal tissues. The red and blue dots indicate more than 1.5-fold change (FC) in dCCA and normal tissues, respectively. (C) The volcano plot of differentially expressed circRNAs (|log2FC| > 1 and p < 0.05). The red and blue dots represent up- and downregulated circRNAs in tumor. (D) The classifications of circRNAs (up: upregulated circRNAs; down: downregulated circRNAs). (E) The circle diagram describes the location of circRNAs on chromosomes. The red and blue lines represent the up- and downregulated circRNAs in tumor tissues. The segment length indicates the FC value.