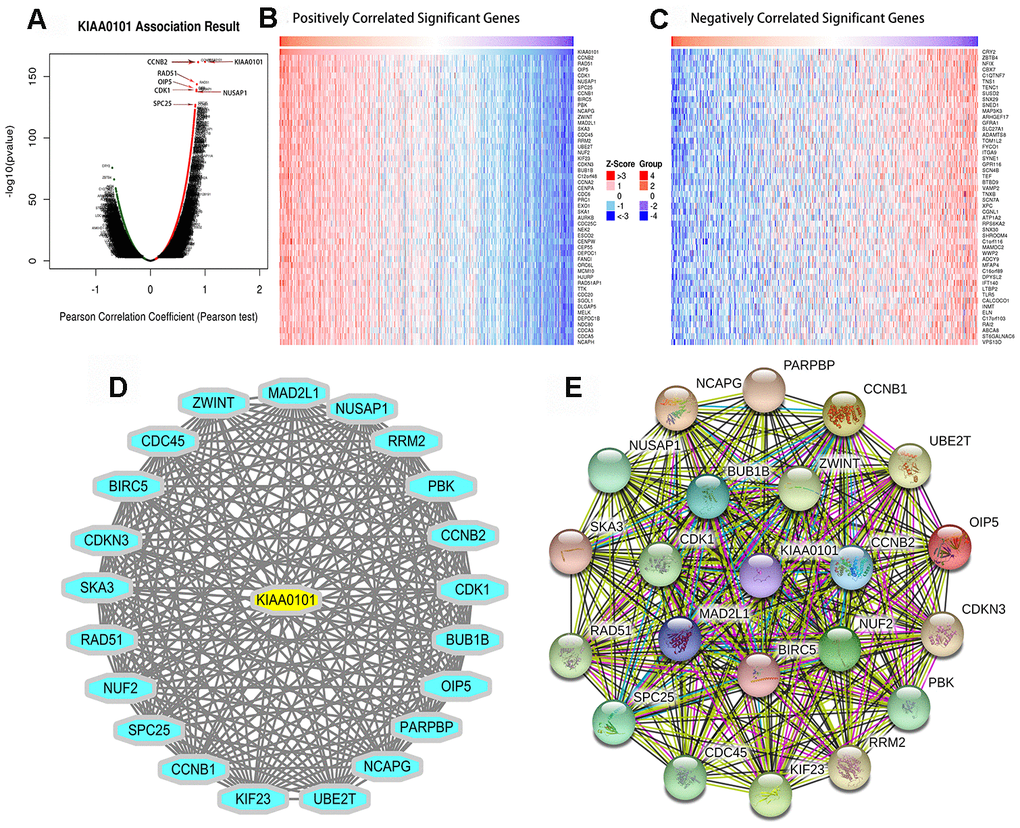
Figure 4.KIAA0101 highly correlated genes. (A) Pearson test was used to analyze the correlation between KIAA0101 and differentially expressed genes in LUAD. (B, C) Heat maps showing the genes that correlated positively and negatively with KIAA0101 in LUAD (top 50). Red indicates positively correlated genes, green indicates negatively correlated genes. (D, E) The network view summarizes the predicted association network of proteins that are strongly related to the protein product of KIAA0101. Network nodes are proteins. The edge represents the functional association of the prediction. A red line indicates the existence of fusion evidence, a green line represents neighborhood evidence, a blue line represents co-occurrence evidence, a purple line represents experimental evidence, a yellow line represents text mining evidence, and a light blue line represents database evidence.