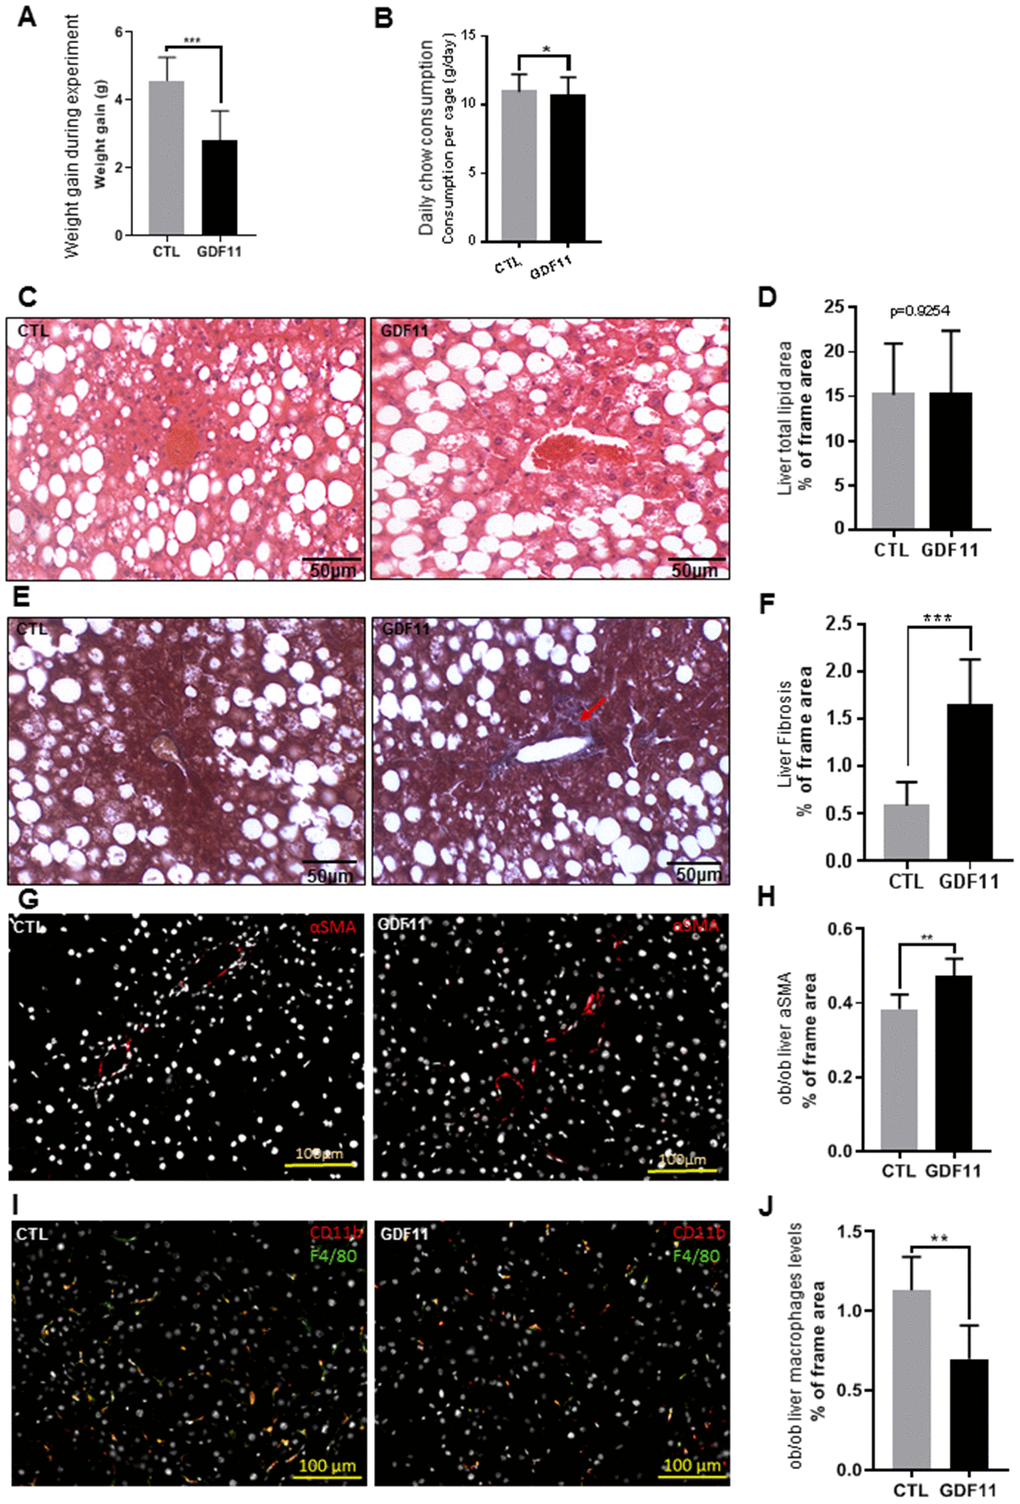
Figure 4.GDF11 accelerates NAFLD progression in obese mice. Obese (ob/ob) mice (n=12 mice per group) were injected daily (for 14 days) with either GDF11 (0.1 mg/kg) or saline. Graphs showing (A) average weight gain during the experiment and (B) average food consumption per cage (n=2 mice per cage). (C) Representative images of H&E stained livers from CTL and GDF11-treated ob/ob mice (n=6 mice per group, 200x magnification). (D) Quantitative morphometric analyses of total lipid area (% of imaged area) as in (C) (n=6 per group, at least fifteen randomly chosen fields per sample were evaluated). (E) Representative images of Masson’s trichrome histological staining to visualize liver fibrosis in CTL and GDF11-treated ob/ob mice (n=6 per group, at least fifteen randomly chosen fields per animal were evaluated, 200x magnification). The red arrow indicates area with increased staining. (F) Morphometric quantification of liver fibrosis (% of total imaged area) (n=6 per group, at least fifteen randomly chosen fields per sample were evaluated). (G) Representative images of αSMA immunostained livers from CTL and GDF11-treated ob/ob mice (n=6 per group, 200x magnification). (H) Quantitative morphometric analyses of total αSMA stained area (%) as in (G) (n=6 per group). (I) Representative images of F4/80 immunostained livers from CTL and GDF11-treated ob/ob mice (n=6 per group, 200x magnification). (J) Quantitative morphometric analyses of total F4/80 stained area (%) as in (I) (n=6 per group at least fifteen randomly chosen fields per sample were evaluated). Data are represented as the mean±SD (or indicated otherwise) * p<0.05, ** p<0.01, *** p<0.001 (Mann-Whitney U-test).