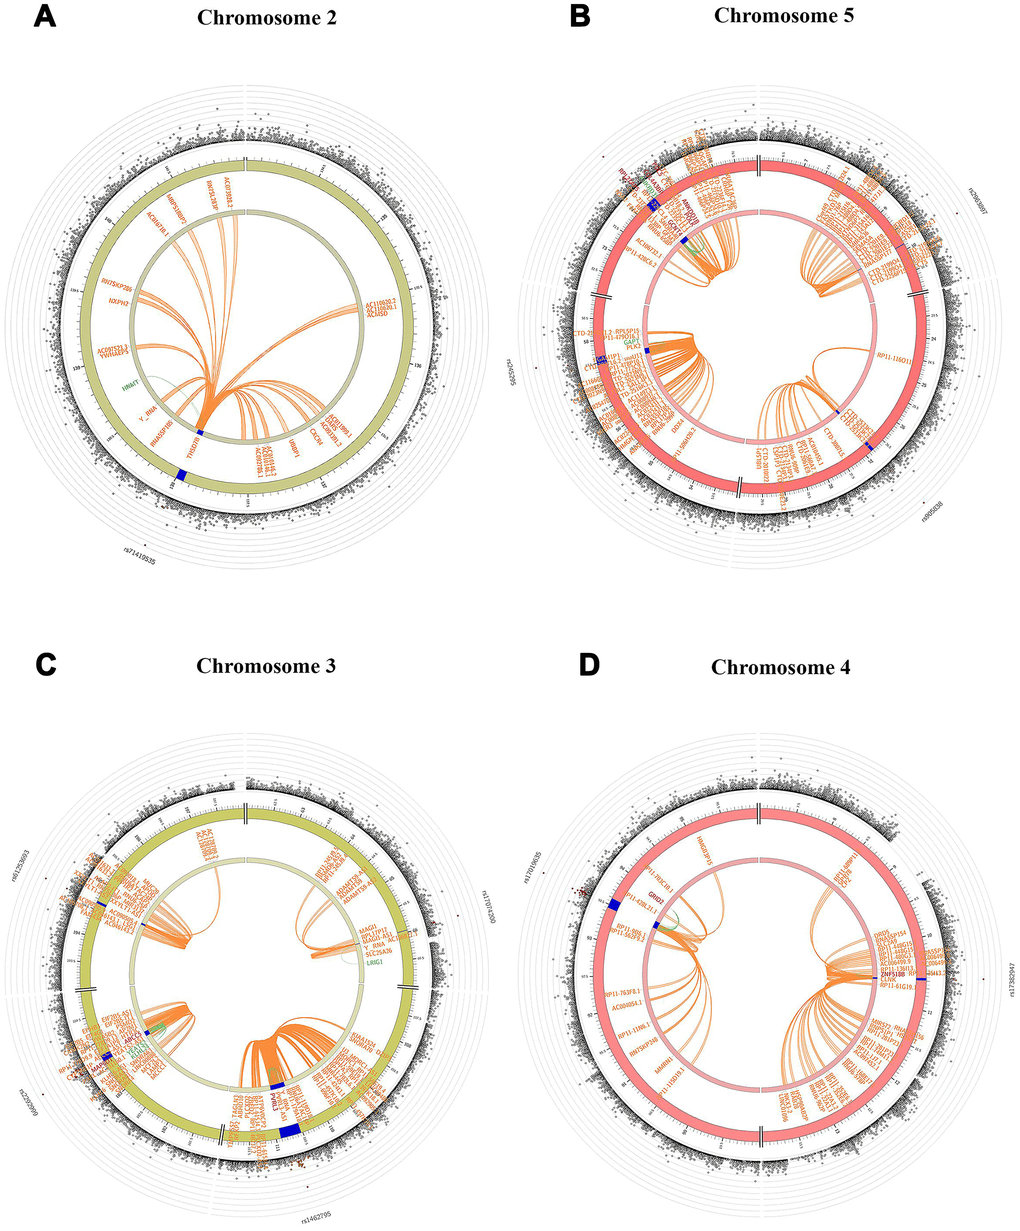
Figure 1.Circos plots indicating genes from genome-wide significant SNPs on chromosomes 2 (A), 5 (B) in Danish sample and 3 (C), 4 (D) in Chinese sample based on GCC model. The blue region shows the genomic risk region. Genes mapped by chromatin interaction, eQTL and both are displayed in orange, green and red respectively. The most outer layer shows a Manhattan plot only for SNPs with p < 0.05 and SNPs are colored in red based on linkage disequilibrium (LD) patterns with the lead SNPs.