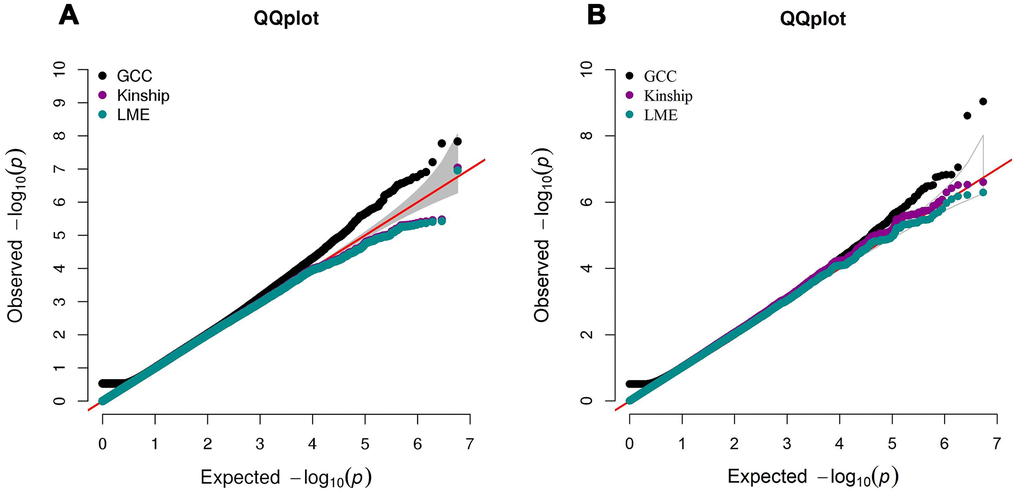
Figure 3.QQ plot comparing the performance of GCC, kinship and LME models in Danish (A) and Chinese (B) GWAS data. The left QQ plot is from Danish sample and the right QQ plot is from Chinese sample. In each plot, x-axis is the expected p-value and y-axis is the observed p-value from the GWAS.