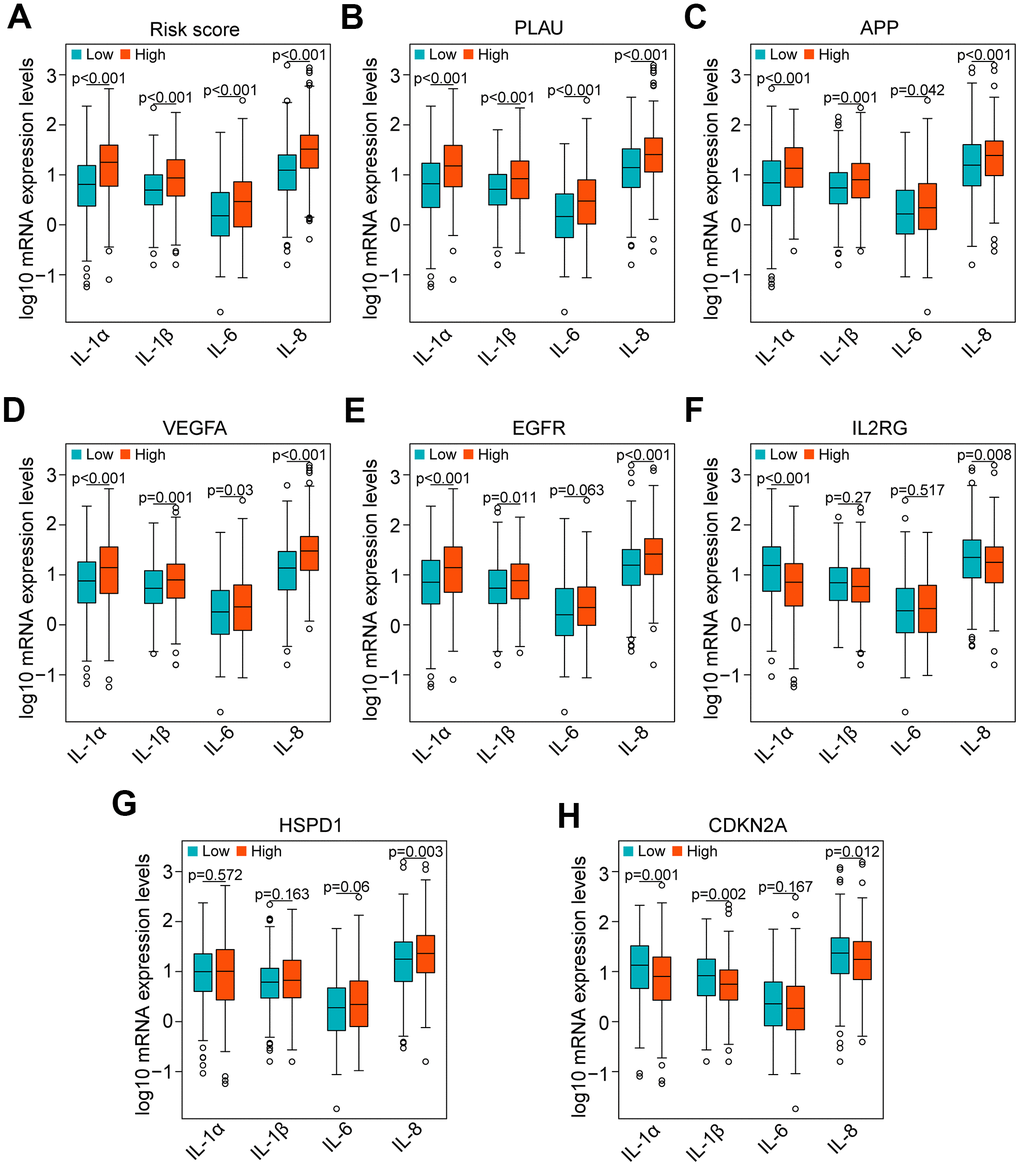
Figure 9.Correlation of proinflammatory factors with the risk score and genes of the risk model in the TCGA data set. (A) Comparison of the main proinflammatory factors (IL-1α, IL-1β, IL-6 and IL-8) between the high-risk and low-risk groups. (B–H) Distribution of the main proinflammatory factors based on high and low expression of PLAU, APP, VEGFA, EGFR, IL2RG, HSPD1 and CDKN2A.