


Introduction
Head and neck squamous cell carcinoma (HNSCC) ranks sixth among cancer-related deaths, with over 300,000 deaths and 600,000 new cases annually worldwide [1]. The main causes of HNSCC include alcohol consumption, smoking, and high-risk human papillomavirus (HR-HPV) infection [2, 3]. Despite innovations in the multimodal treatment of HNSCC, including surgery, chemoradiotherapy, and targeted drugs, the 5-year survival rate has not improved significantly [4]. Therefore, robust and reliable biomarkers are necessary for efficient early diagnosis and individualized intervention strategies to decrease the mortality rates of HNSCC patients.
Aging is regarded as a time-based or progressive decline of internal physiological function and as a dominant risk factor for many chronic diseases, including cancer, which is now a hot field of cancer research [5, 6]. Cellular senescence acts as a key contributor to the aging progress and to the development of cancers [7]. The effects of senescent cells on tumors are extremely complex, which can be both profitable and deleterious. The senescent neoplastic cells induced by oncogenesis can cause cell-cycle arrest, which appears to be a puissant anti-tumor mechanism [8]. However, the effect of senescent cells on neighboring cancer cells may be the opposite and is closely associated with the secretion of senescence-associated secretory phenotype (SASP) factors [9–11]. Furthermore, cellular senescence-related inflammation has dual effects on tumor immunity [12–14]. Aging-related genes (AGs) play an important role in the regulation of cellular senescence, which can not only inhibit tumors by regulating tumor cell senescence but also promote the development, invasion, metastasis, progression and poor prognosis of tumor [6, 15–17]. However, few studies have systematically analyzed the relationship between AGs and the prognosis of head and neck squamous cell carcinoma (HNSCC). In addition, their correlations with inflammation and tumor immunity in HNSCC remain unclear.
The human aging genome resource (HAGR) is a database identifying a robust set of aging-specific network characteristics that has revealed aging-related genes as network hubs via systemic analysis of the biology and genetics of the human aging process [18]. To evaluate the prognostic values of AGs in HNSCC, we downloaded gene expression profiles of HNSCC patients from The Cancer Genome Atlas (TCGA) database for risk model construction to reveal the AG set related with the prognosis of HNSCC and the potential association between the risk model and inflammation and tumor immunity.
Results
Analysis of differentially expressed AGs in HNSCC samples
A total of 307 human AGs (Supplementary Table 1) obtained from the HAGR were distributed on all chromosomes, except for sex chromosome Y (Supplementary Figure 1). Based on the expression of the AGs in the TCGA dataset (clinical characteristics are showed in Table 1), we identified 41 differentially expressed AGs (DEAGs), including 39 upregulated and 2 downregulated DEAGs (FDR < 0.05 and |logFC| > 1). The DEAGs are listed in Supplementary Table 2 and are visualized with a hierarchical cluster heat map (Figure 1A) and a volcano plot (Figure 1B).
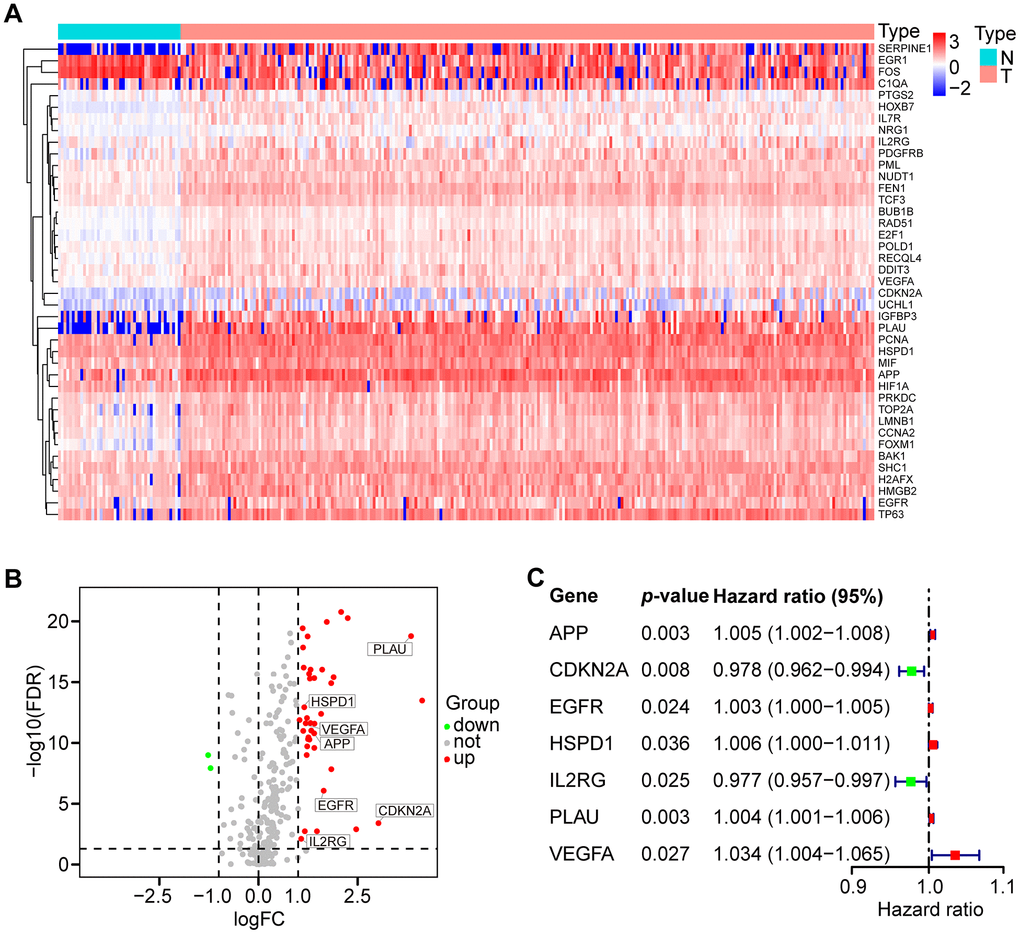
Figure 1. Differential expression of aging-related genes (AGs) and 7 AGs of prognostic risk models in HNSCC samples. (A) Hierarchical cluster heat map visualizing 41 differentially expressed AGs (DEAGs). (B) Volcano plot showing 39 upregulated and 2 downregulated DEAGs (FDR < 0.05 and |logFC| > 1). (C) Forest plot showing the characteristics of 7 risk DEAGs in the prognostic risk models.
Table 1. Clinical characteristics of HNSCC patients in the TCGA and GEO data sets.
| Clinical characteristics | TCGA | GEO (GSE65858) | ||
| n=500 | % | n=270 | % | |
| Age | ||||
| < 60 | 220 | 44.0 | 153 | 56.7 |
| ≥ 60 | 280 | 56.0 | 117 | 43.3 |
| Gender | ||||
| Female | 133 | 26.6 | 47 | 17.4 |
| Male | 367 | 73.4 | 223 | 82.6 |
| Histologic grade | ||||
| G1-2 | 360 | 72.0 | ||
| G3-4 | 121 | 24.2 | ||
| Gx | 16 | 3.2 | ||
| NA | 3 | 0.6 | ||
| Stage | ||||
| I-II | 114 | 22.8 | 55 | 20.4 |
| III-IV | 372 | 74.4 | 215 | 79.6 |
| NA | 14 | 2.8 | ||
| T classification | ||||
| T1-2 | 176 | 35.2 | 115 | 42.6 |
| T3-4 | 309 | 61.8 | 155 | 57.4 |
| Tx | 11 | 2.2 | ||
| NA | 4 | 0.8 | ||
| N classification | ||||
| N0 | 239 | 47.8 | 94 | 34.8 |
| N+ | 239 | 47.8 | 176 | 65.2 |
| Nx | 18 | 3.6 | ||
| NA | 4 | 0.8 | ||
| M classification | ||||
| M0 | 470 | 94.0 | 263 | 97.4 |
| M1 | 5 | 1.0 | 7 | 2.6 |
| Mx | 20 | 4.0 | ||
| NA | 5 | 1.0 | ||
| Vital status | ||||
| Deceased | 218 | 43.6 | 94 | 34.8 |
| Living | 282 | 56.4 | 176 | 65.2 |
Functional analysis of DEAGs in the TCGA data set
The potential function and connection of DEAGs in the TCGA dataset were analyzed using GO and KEGG pathway analyses. The top 30 enriched pathways of KEGG pathway analysis are shown as an enriched scatter diagram (Figure 2A). These results revealed that the DEAGs might be associated with cell cycle, cellular senescence, microRNAs in cancer, human T-cell leukemia virus 1 infection and other KEGG pathways in multiple cancers. The top 10 enriched GO terms of BP, CC and MF for the DEAGs are also shown as a scatter diagram (Figure 2B). The most significantly enriched term in the biological process was related to the aging process. These GO terms were also associated with the occurrence and development of cancer. The functional analysis revealed that the DEAGs are closely related to aging, cellular senescence and cancer.
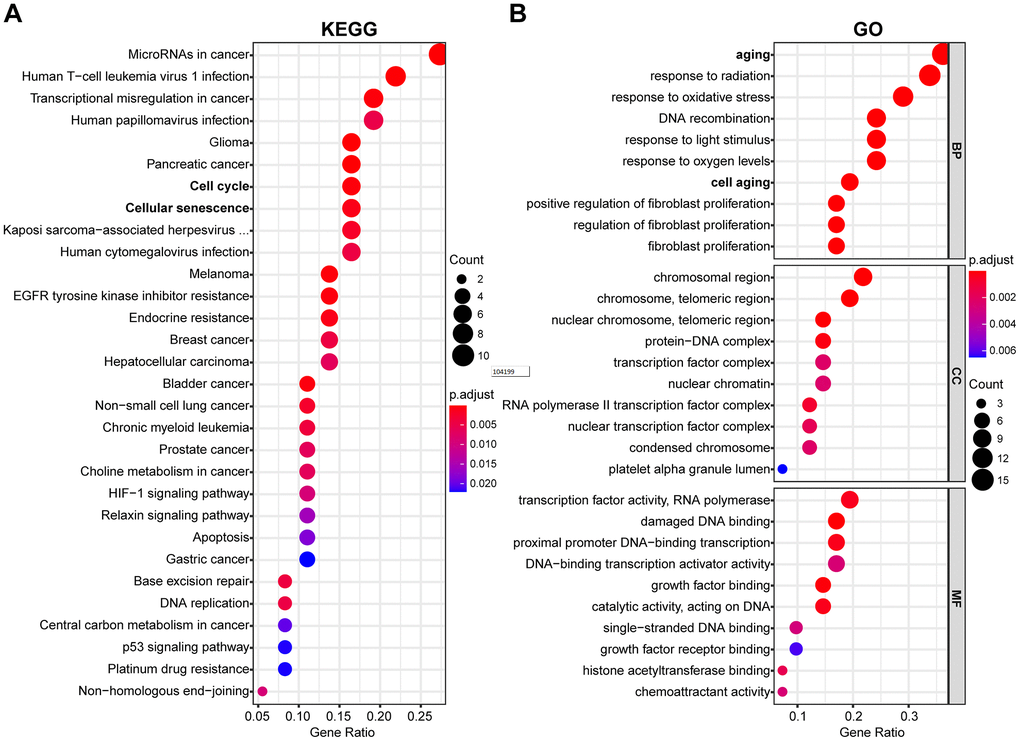
Figure 2. Functional enrichment analysis of DEAGs of the TCGA data set. (A) The top 30 enriched pathways from KEGG pathway analysis are displayed using an enriched scatter diagram. (B) The top 10 enrichment GO terms of BP, CC and MF for DEAGs are also displayed with a scatter diagram. KEGG, Kyoto Encyclopedia of Genes and Genomes. GO, Gene Ontology; BP, biological process; CC, cell component; MF, molecular function.
Identification of a prognostic risk model in the TCGA training set
To identify prognostic DEAGs in HNSCC, the expression of the 41 DEAGs from the TCGA training set was assessed by univariate Cox regression analysis. Seven survival-associated DEAGs, including APP, CDKN2A, EGFR, HSPD1, IL2RG, PLAU and VEGFA, in HNSCC are shown by a forest plot (Figure 1C). Then, a prognostic risk model of 7 survival-associated DEAGs was constructed with LASSO regression analysis. The information and the coefficient values of the 7 genes are displayed in Table 2. The prognostic risk score of each patient was calculated with the following formula:
Table 2. The seven genes associated with the risk model in HNSCC.
| ENSG ID | Symbol | Location | Expression status | Coefficient |
| ENSG00000142192 | APP | Chromosome 21 | Upregulated | 0.0026 |
| ENSG00000147889 | CDKN2A | Chromosome 9 | Upregulated | -0.0132 |
| ENSG00000146648 | EGFR | Chromosome 7 | Upregulated | 0.0016 |
| ENSG00000144381 | HSPD1 | Chromosome 2 | Upregulated | 0.0048 |
| ENSG00000147168 | IL2RG | Chromosome X | Upregulated | -0.0113 |
| ENSG00000122861 | PLAU | Chromosome 10 | Upregulated | 0.0017 |
| ENSG00000112715 | VEGFA | Chromosome 6 | Upregulated | 0.0215 |
Risk score = APP * 0.0026 + CDKN2A * (-0.0132) + EGFR * 0.0016 + HSPD1 * 0.0048 + IL2RG * (-0.0113) + PLAU * 0.0017 + VEGFA * 0.0215
The patients from the TCGA training set were classified into low-risk and high-risk groups based on the median cutoff value of the risk score (0.709). Survival analysis indicated that the overall survival (OS) of the high-risk group was significantly worse than that of the low-risk group (P < 0.001, Figure 3A). The receiver operating characteristic (ROC) curves analysis demonstrated acceptable discrimination with the area under the ROC (AUC) of 0.664, which was higher than the AUC of other clinical parameters (Figure 3B). The risk plot with the distribution of patients based on risk scores, the survival status of individual HNSCC patients and the heat maps of the expression profiles of the risk genes are displayed in Figure 4A.
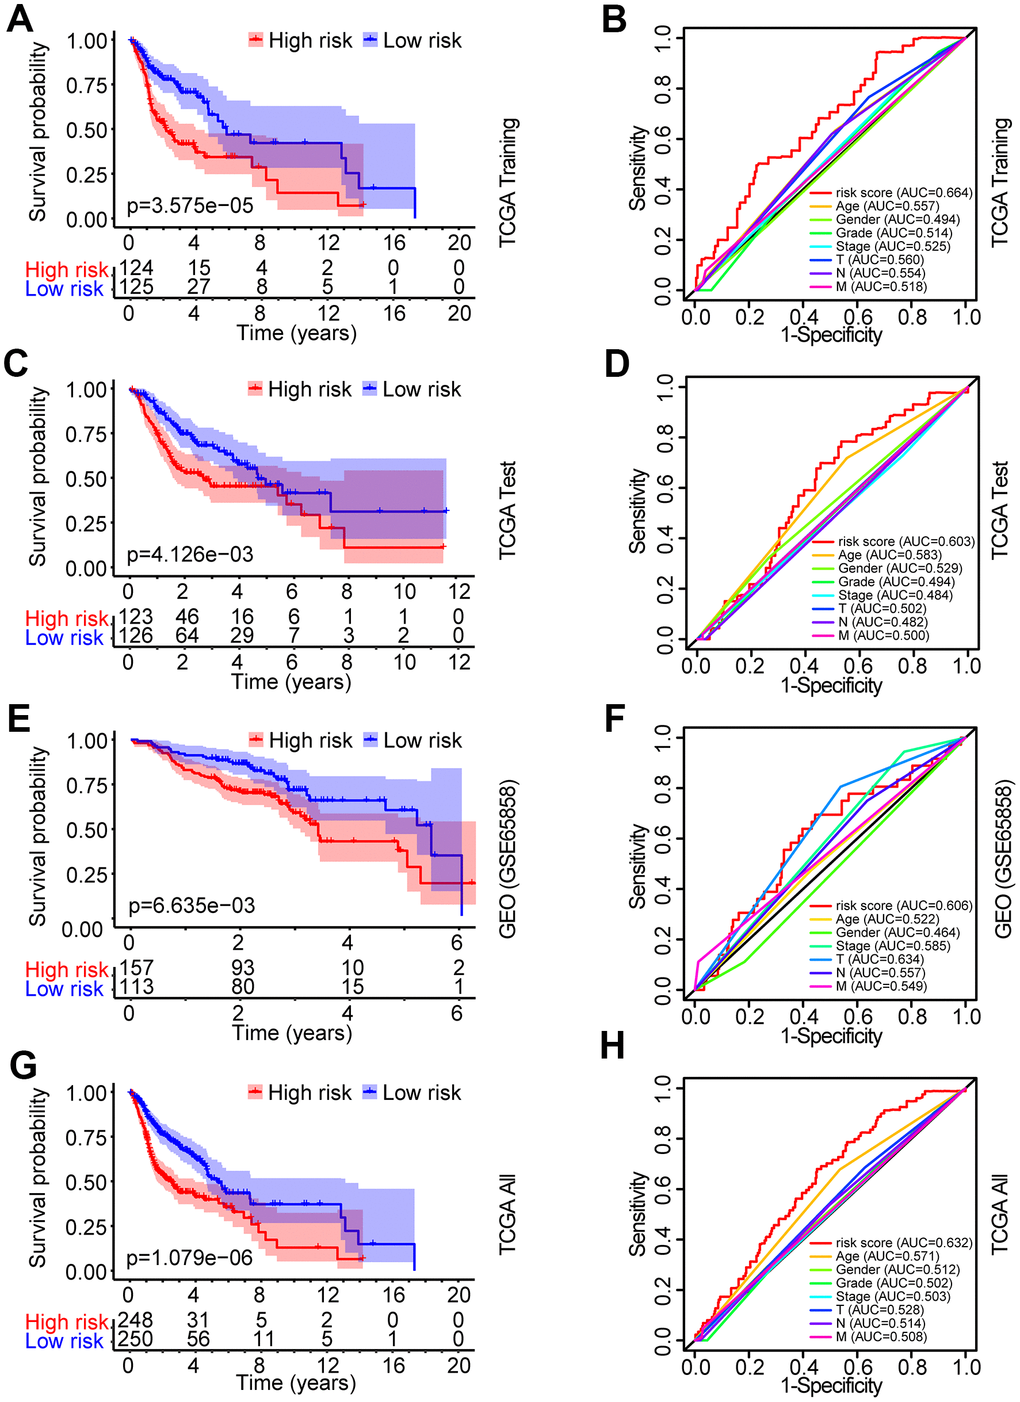
Figure 3. Identification and verification of the prognostic risk model in HNSCC. (A) Kaplan-Meier survival curve analysis of OS in the high-risk and low-risk groups of HNSCC patients in the TCGA training set. (B) ROC curve analysis and AUC for the risk score of AGs in the TCGA training set. (C, E, G) Kaplan-Meier survival curve analysis of OS in the high-risk and low-risk groups of HNSCC patients in the TCGA test set, GEO data set and TCGA all data set, respectively. (D, F, H) ROC curve analysis and AUC for the risk score of AGs in the TCGA test set, GEO data set and TCGA all data set, respectively.
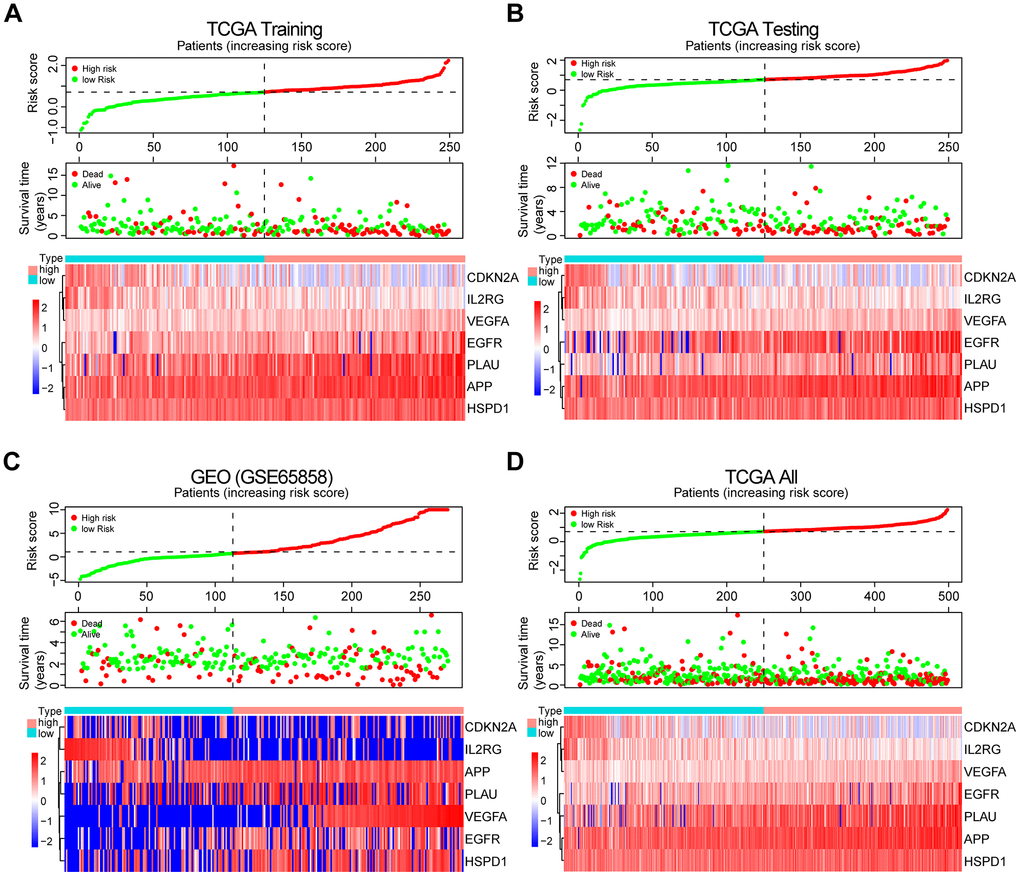
Figure 4. Prognosis and expression of risk genes in the high-risk and low-risk groups of HNSCC patients. (A) Risk plot distribution, survival status, and expression of risk genes of HNSCC patients in the TCGA training set. (B) Risk plot distribution, survival status, and expression of risk genes of HNSCC patients in the TCGA test set. (C) Risk plot distribution, survival status, and expression of risk genes of HNSCC patients in the GEO test set. (D) Risk plot distribution, survival status, and expression of risk genes of HNSCC patients in the TCGA all data set.
Verification of the prognostic risk model in the validation data sets
To validate the robustness of the prognostic risk model of the risk genes, we tested the model with independent validation data sets. With the prognostic risk model from the TCGA training data set, all patients in the TCGA test data set were also classified into high-risk (n = 123) and low-risk (n = 126) groups. Kaplan-Meier survival curve analysis demonstrated patient OS in the low-risk group was better than that in the high-risk group (P < 0.01, Figure 3C). ROC curves analysis for the TCGA test set achieved an AUC of 0.608, which was higher than the AUC for the other clinical parameters (Figure 3D).
Further validation of the risk model for prognostic prediction was performed using an external independent GEO data set (GSE65858) with 270 HNSCC patients (clinical characteristics are showed in Table 1). With the same risk model, the patients in the GEO test set were segregated into high-risk (n = 157) and low-risk (n = 113) groups, and the model could distinguish patient survival between the high-risk and low-risk groups (P < 0.01, Figure 3E). The ROC curves analysis for the GEO test set achieved an AUC of 0.606, which was higher than the AUC of the other clinical parameters, except for T stage (Figure 3F).
A similar analysis was also exploited in the TCGA all data set. The patients in the TCGA all set were divided into high-risk (n = 248) and low-risk (n = 250) groups with significantly different survival (P < 0.001, Figure 3G). ROC curves analysis for the TCGA all data set achieved an AUC of 0.632, which was higher than the AUC of the other clinical parameters (Figure 3H).
The risk plot distribution, survival status, and expression of risk genes of the patients in the TCGA and GEO (GSE65858) test sets and TCGA all data set are shown in Figure 4B–4D.
Independent prognostic predictive value of the risk score in HNSCC patients
To investigate the independence of the risk model in clinicopathological factors, we performed univariate and multivariate Cox regression analysis of the clinicopathological parameters of the patients in the TCGA training set, TCGA test set, GEO test set and TCGA all data set, including risk score, age, gender, grade, clinical stage, and TNM stage. Among the training set and multiple test sets, univariate and multivariate Cox regression analyses showed that only the risk score was consistently significantly associated with prognosis, such as the TCGA training set (HR = 3.111, 95% CI = 2.042-4.741, P < 0.001; HR = 3.600, 95% CI = 2.293-5.652, P < 0.001, respectively, Figure 5A, 5B), the TCGA test set (HR = 1.573, 95% CI = 1.068-2.316, P < 0.05; HR = 1.520, 95% CI = 1.027-2.251, P < 0.05, respectively, Supplementary Figure 2A, 2B), the GEO data set (HR = 1.239, 95% CI =1.052-1.459, P < 0.05; HR = 1.238, 95% CI = 1.045-1.466, P < 0.05, respectively, Supplementary Figure 2C, 2D) and the TCGA all data set (HR = 2.148, 95% CI = 1.619-2.850, P < 0.05; HR = 2.202, 95% CI = 1.650-2.939, P < 0.05, respectively, Supplementary Figure 2E, 2F). The results revealed that the risk model is a robust prognostic index independent of other clinicopathological parameters.
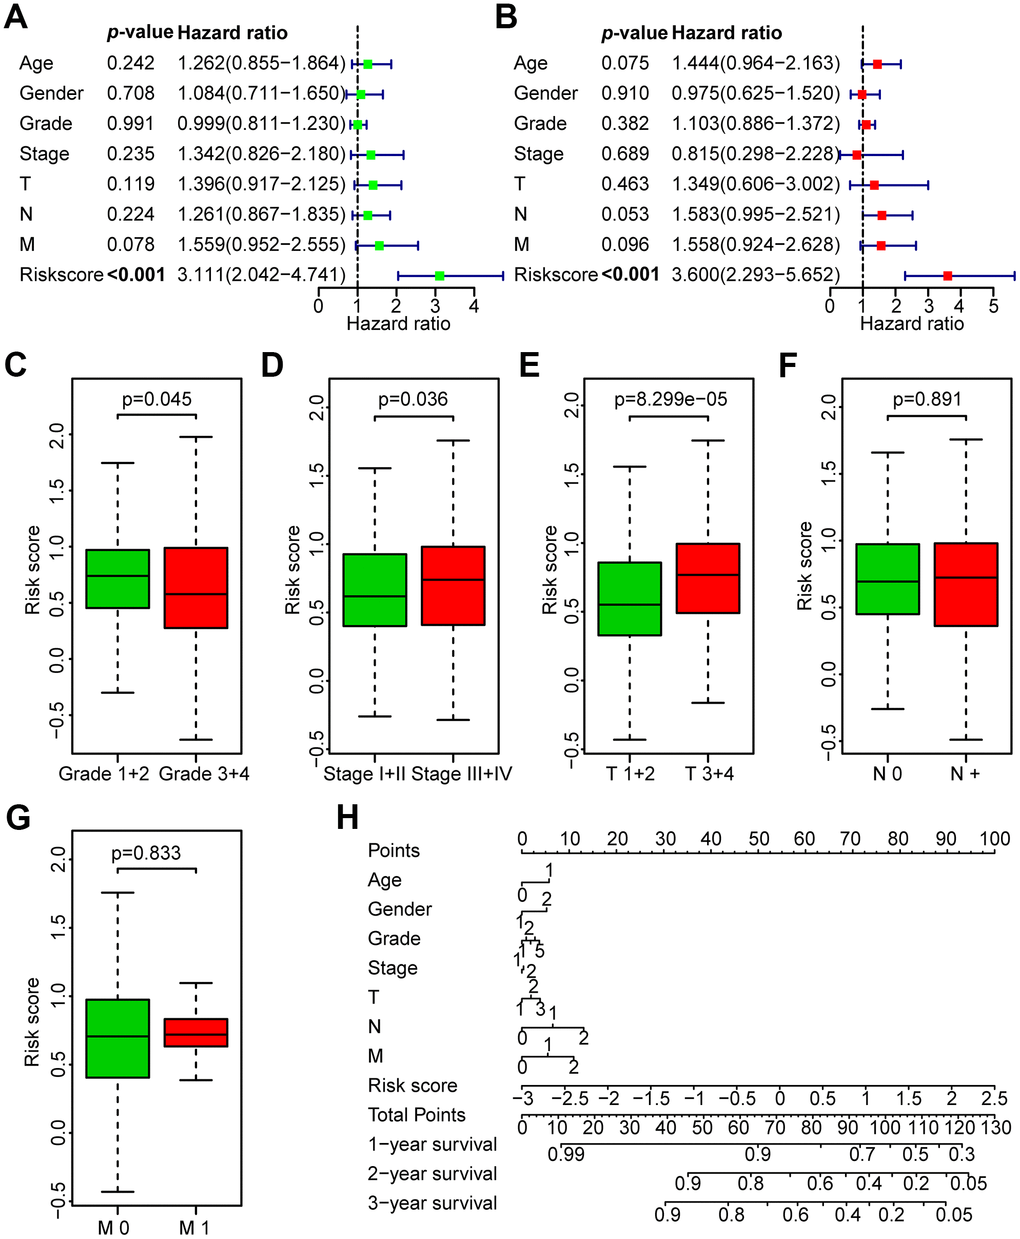
Figure 5. Correlation between the risk score and the clinicopathological characteristics of HNSCC patients. (A) Univariate Cox regression analysis of clinicopathological parameters of the patients in the TCGA training set. (B) Multivariate Cox regression analysis of the clinicopathological parameters of the patients in the TCGA training set. (C) Subgroup analysis of pathology grade (Grades 1+2 vs. Grades 3+4). (D) Subgroup analysis of clinical stage (Stages I+II vs. Stages III+IV). (E) Subgroup analysis of T classification (T 1+2 vs. T 3+4). (F) Subgroup analysis of N classification (N0 vs. N+). (G) Subgroup analysis of M classification (M 0 vs. M 1). (H) Nomogram for OS of HNSCC patients.
Association between the risk score and the clinicopathological characteristics of HNSCC patients in the TCGA data set
Next, the association between the risk score and clinicopathological parameters was investigated (Figure 5C–5G, Table 3). The level of risk score was significantly related to histological grade (P < 0.05), clinical stage (P < 0.05), and T stage (P < 0.001). However, it was not correlated with other clinicopathological parameters, including N stage (P = 0.891) or M stage (P = 0.833). These results demonstrate that the risk score is closely associated with the progression of HNSCC. Next, a nomogram containing the risk score and clinicopathological parameters was constructed (Figure 5H).
Table 3. Correlation between the clinicopathologic characteristics and the risk score (logistic regression) in HNSCC patients in the TCGA data set.
| Clinical characteristics | Total (N) | Odds ratio in the risk score | p-value |
| Age (≥60 vs. <60) | 498 | 1.016(0.713-1.448) | 0.928 |
| Gender | 498 | 1.085 (0.729-1.619) | 0.685 |
| Grade (G1-2 vs. G3-4) | 479 | 0.630 (0.413-0.953) | 0.030 |
| Stage (I-II vs. III-IV) | 484 | 1.484 (0.972-2.278) | 0.039 |
| Local invasion (T1-2 vs. 3-4) | 483 | 2.173 (1.490-3.188) | 0.000 |
| Lymph nodes (N0 vs. N+) | 476 | 1.070 (0.747-1.533) | 0.714 |
| Distant metastasis (M0 vs. M1) | 473 | 1.513 (0.248-11.564) | 0.652 |
GSEA of risk score-related signaling pathways
GSEA was performed to identify significantly enriched pathways in the high-risk and low-risk groups in the TCGA data set. Thirty enriched pathways in the high-risk and low-risk groups were evaluated (Supplementary Table 5). Enriched pathways with significant differences (FDR < 0.25, NOM p < 0.05) were selected (Table 4). The results demonstrated that galactose metabolism, nitrogen metabolism, ERBB signaling pathway and pathways in cancer were significantly enriched in the high-risk group (Figure 6A, 6B) and that arachidonic acid metabolism, fatty acid metabolism, linoleic acid metabolism, B cell receptor signaling pathway, T cell receptor signaling pathway, intestinal immune network for IgA production and cytokine_cytokine receptor interaction were significantly enriched in the low-risk group (Figure 6C, 6D). Interestingly, the B cell receptor signaling pathway and T cell receptor signaling pathway were enriched in the low-risk group (Figure 6E, 6F), which indicated that a high risk score may be associated with immunosuppression. Other individual GSEA diagrams are shown in Supplementary Figure 3.
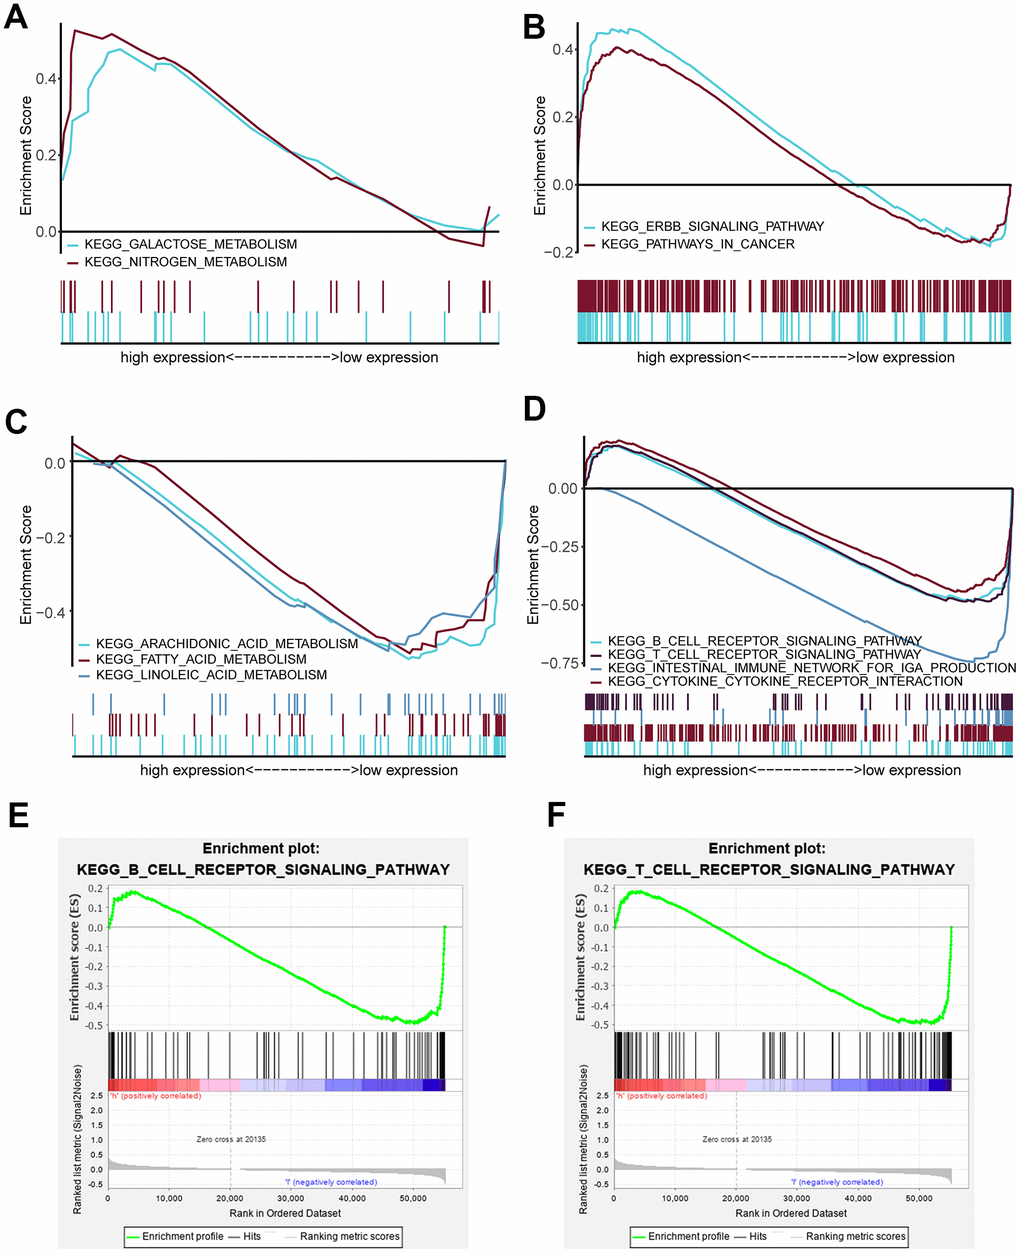
Figure 6. Enriched pathways of the high-risk and low-risk groups via GSEA. (A) Multiple GSEA for metabolism of the high-risk group: galactose metabolism and nitrogen metabolism. (B) Multiple GSEA for cancer pathways of the high-risk group: the ERBB signaling pathway and pathway in cancer. (C) Multiple GSEA for metabolism of the low-risk group: arachidonic acid metabolism, fatty acid metabolism and linoleic acid metabolism. (D) Multiple GSEA for inflammation and immunity of the low-risk group: the B cell receptor signaling pathway, T cell receptor signaling pathway, intestinal immune network for IgA production and cytokine_cytokine receptor interaction. (E) Single GSEA showing the B cell receptor signaling pathway. (F) Single GSEA showing the T cell receptor signaling pathway.
Table 4. Gene sets enriched in high and low risk scores.
| MSigDB collection | Name | NES | ES | NOM p-value | FDR q-value |
| c2.cp.kegg.v7.1.symbols.gmt | KEGG_ERBB_SIGNALING_PATHWAY | 1.658 | 0.460 | 0.024 | 0.197 |
| KEGG_PATHWAYS_IN_CANCER | 1.619 | 0.406 | 0.022 | 0.193 | |
| KEGG_GALACTOSE_METABOLISM | 1.520 | 0.477 | 0.042 | 0.247 | |
| KEGG_NITROGEN_METABOLISM | 1.511 | 0.526 | 0.044 | 0.233 | |
| KEGG_INTESTINAL_IMMUNE_NETWORK_FOR_IGA_PRODUCTION | -2.047 | -0.761 | 0.000 | 0.016 | |
| KEGG_ARACHIDONIC_ACID_METABOLISM | -1.916 | -0.542 | 0.002 | 0.040 | |
| KEGG_FATTY_ACID_METABOLISM | -1.668 | -0.531 | 0.024 | 0.135 | |
| KEGG_CYTOKINE_CYTOKINE_RECEPTOR_INTERACTION | -1.655 | -0.446 | 0.033 | 0.139 | |
| KEGG_T_CELL_RECEPTOR_SIGNALING_PATHWAY | -1.633 | -0.494 | 0.042 | 0.126 | |
| KEGG_B_CELL_RECEPTOR_SIGNALING_PATHWAY | -1.594 | -0.491 | 0.048 | 0.128 | |
| KEGG_LINOLEIC_ACID_METABOLISM | -1.593 | -0.533 | 0.045 | 0.124 |
Association between the risk score and tumor immunity
To investigate the association between the risk score and immune/stromal score, we used the ESTIMATE algorithm to evaluate the immune/stromal score of the TCGA data set. The low-risk group had higher immune scores in tumor samples than the high-risk group (P < 0.0001, Figure 7A). In addition, Spearman’s rank test revealed that there was a significant negative correlation between the risk score and immune score in HNSCC samples (R = -0.39, P < 0.0001, Figure 7B). However, there was no significant correlation between the risk score and stromal score in HNSCC samples (R = 0.031, P = 0.031, Figure 7C). The correlation between the risk score and ESTIMATE score in HNSCC samples was also tested (R = -0.21, P < 0.0001, Figure 7D).
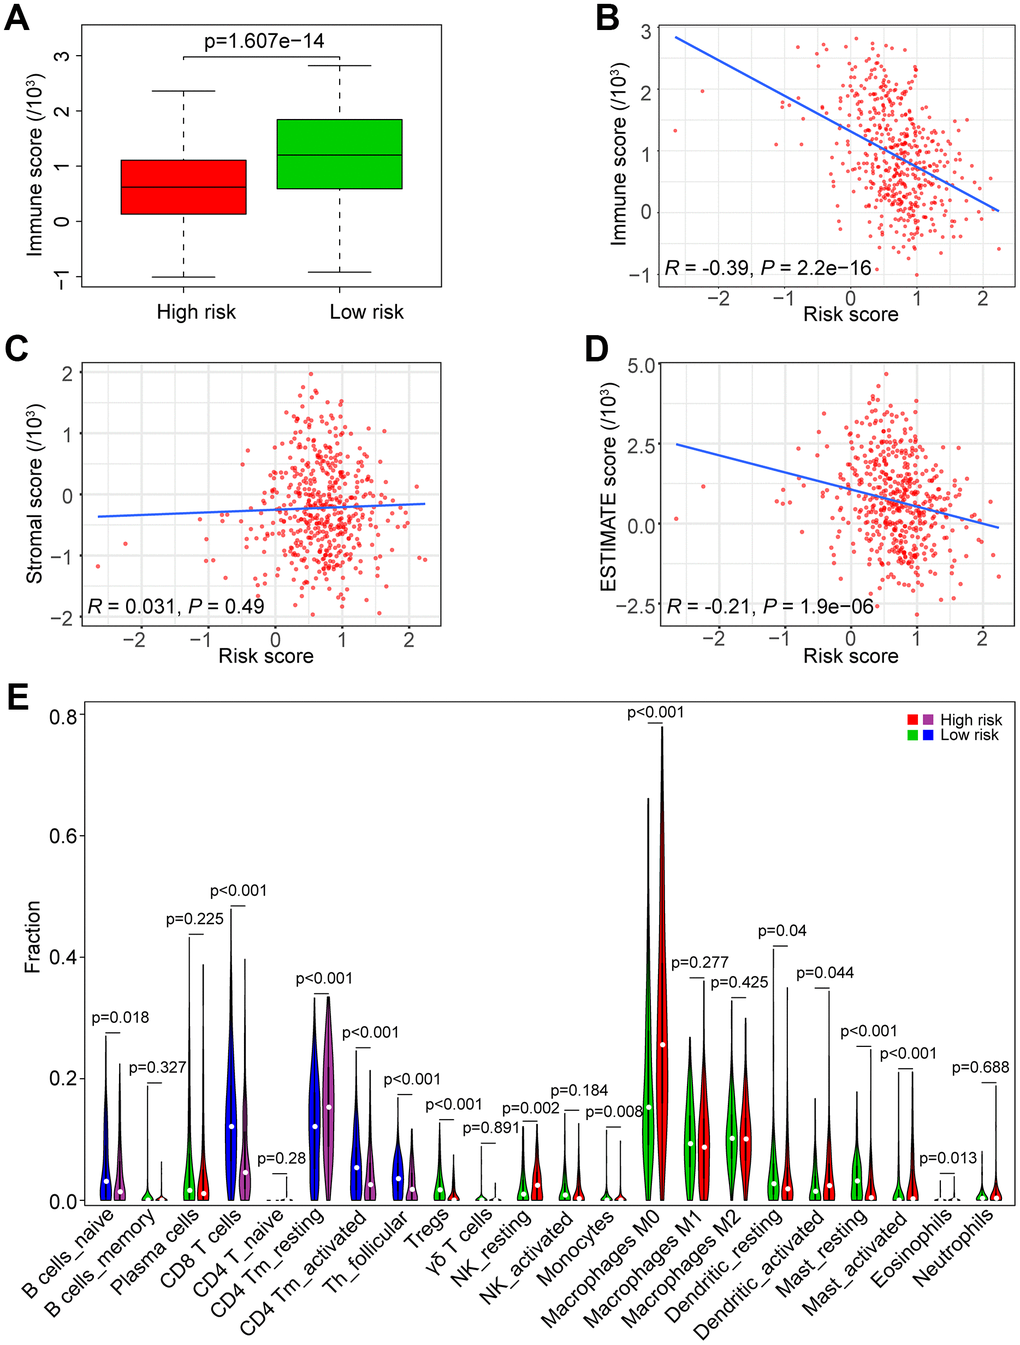
Figure 7. Association of the risk score with tumor immunity in the TCGA data set. (A) Distribution of immune scores according to the risk score of HNSCC patients. (B) Correlation of the risk score with the immune score in HNSCC samples. (C) Correlation of the risk score with the stromal score in HNSCC samples. (D) Correlation of the risk score with the ESTIMATE score in HNSCC samples. (E) Comparisons of immune cells between the high-risk and low-risk groups.
We estimated the composition fraction of tumor-infiltrating immune cell types of patients in the TCGA data set utilizing the CIBERSORT algorithm to compare the relationship between the risk score and immune cells (Figure 7E). The results showed that HNSCC samples in the high-risk group contained a lower fraction of naïve B cells (P < 0.05), CD8 T cells (P < 0.001), CD4 memory activated T cells (P < 0.001) and follicular helper T cells (P < 0.001) compared to those in the low-risk group. However, CD4 memory resting T cells exhibited the opposite result (P < 0.001). These results are consistent with those of the GSEA in Figure 6E, 6F, which showed that a high risk score was associated with immunosuppression.
Correlation of the five immune cells with genes in the risk model
Based on the association between the risk model and the above five immune cell types (Figure 8A), we analyzed the correlation of the five immune cells with the 7 genes of the risk model. HNSCC samples with high PLAU expression contained a lower fraction of naïve B cells, CD8 T cells, CD4 memory activated T cells and follicular helper T cells compared to those with low expression, and CD4 memory resting T cells exhibited the opposite result (all P < 0.05, Figure 8B), which was consistent with the risk score. HNSCC samples with high APP expression compared to those with low expression showed that except for naïve B cells (P = 0.247), the results were consistent with the result of the risk score (all P < 0.01, Figure 8C). Similarly, the results of EGFR, except naïve B cells (P = 0.254) and CD4 memory activated T cells (P = 0.254), were consistent with the result of the risk score (all P < 0.01, Figure 8D). However, the results of IL2RG, as a protective factor, were not consistent with the results of the risk score (Figure 8E). Furthermore, the results of CDKN2A, HSPD1 and VEGFA showed that there was no significant difference in the five immune cells between the patients with high and low expression (all P > 0.05, Figure 8F–8H). Hence, the aging-related genes PLAU, APP and EGFR play a key role in immunosuppression of HNSCC.
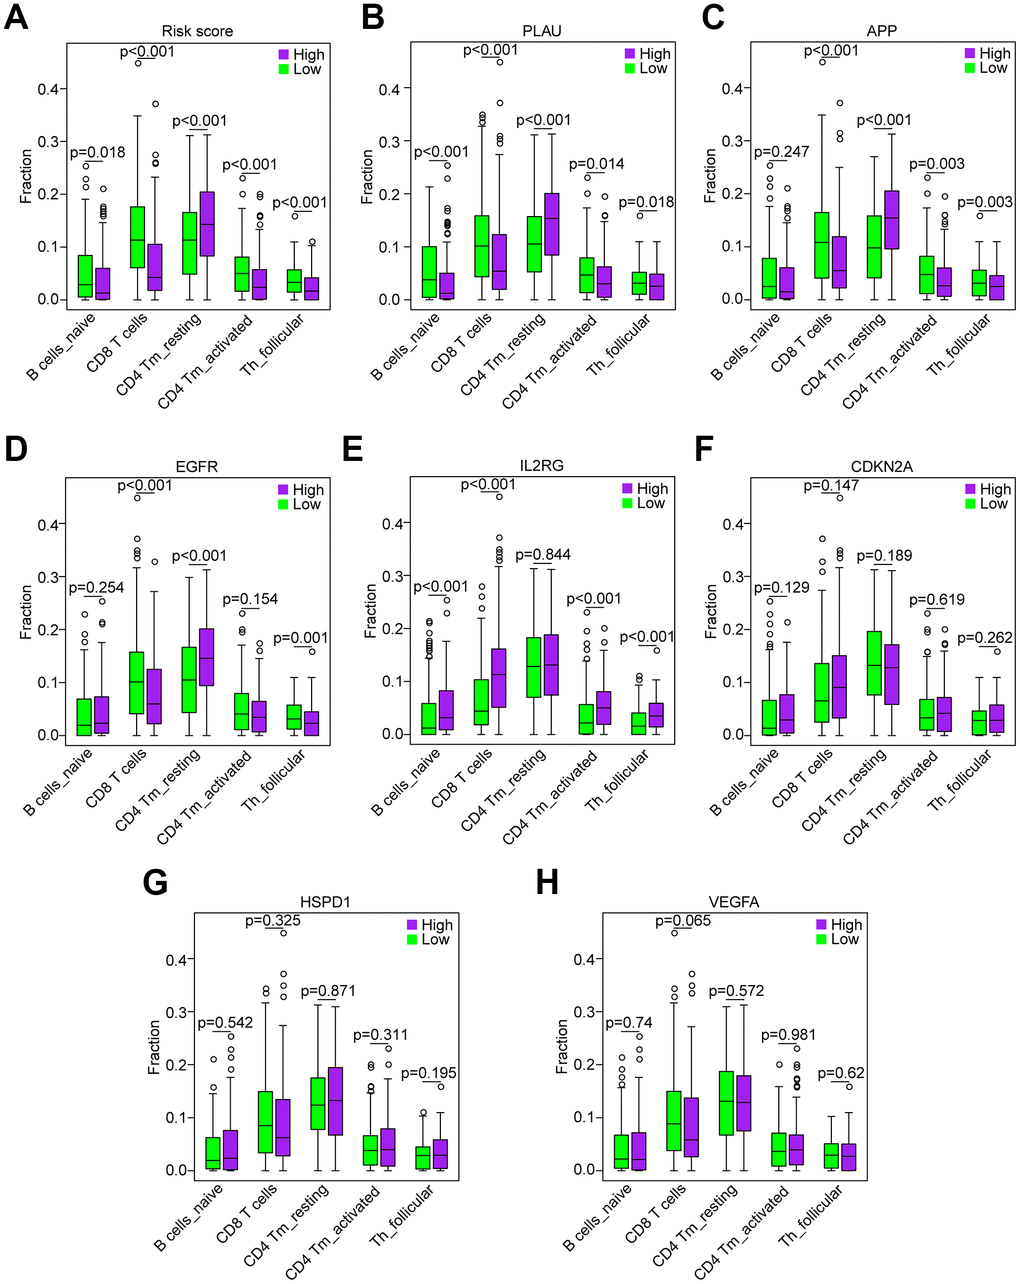
Figure 8. Correlation of the five immune cells with genes of the risk model in the TCGA data set. (A) Comparison of the five immune cells (naïve B cells, CD8 T cells, CD4 memory activated T cells and follicular helper T cells) between the high-risk and low-risk groups. (B–H) Distribution of the five immune cells based on the high expression and low expression of PLAU, APP, EGFR, IL2RG, CDKN2A, HSPD1 and VEGFA.
Correlation of proinflammatory factors with the risk score and genes of the risk model
Currently, accumulating studies have demonstrated that chronic inflammation related to cellular senescence plays a key role in tumor immunosuppression and major proinflammatory factors, including IL-1α, IL-1β, IL-6 and IL-8 [12–14]. Therefore, we investigated the correlation of major proinflammatory factors with the risk score and genes in the risk model. The results showed that mRNA expression levels of IL-1α, IL-1β, IL-6 and IL-8 in high-risk HNSCC samples were significantly higher than those in low-risk samples (all P < 0.001, Figure 9A). Consistent with the result of the risk score, the results of PLAU, APP and VEGFA also showed that the mRNA expression levels of IL-1α, IL-1β, IL-6 and IL-8 in HNSCC samples with high expression of PLAU, APP and VEGFA were significantly higher than those with low expression (all P < 0.05, Figure 9B–9D). Similarly, the results of EGFR, except for IL-6 (P = 0.063), were consistent with the results of the risk score (all P < 0.05, Figure 9E). However, the results of IL2RG, HSPD1 and CDKN2A were either opposite of the results of the risk score, or there was no significant difference (Figure 9F–9H).
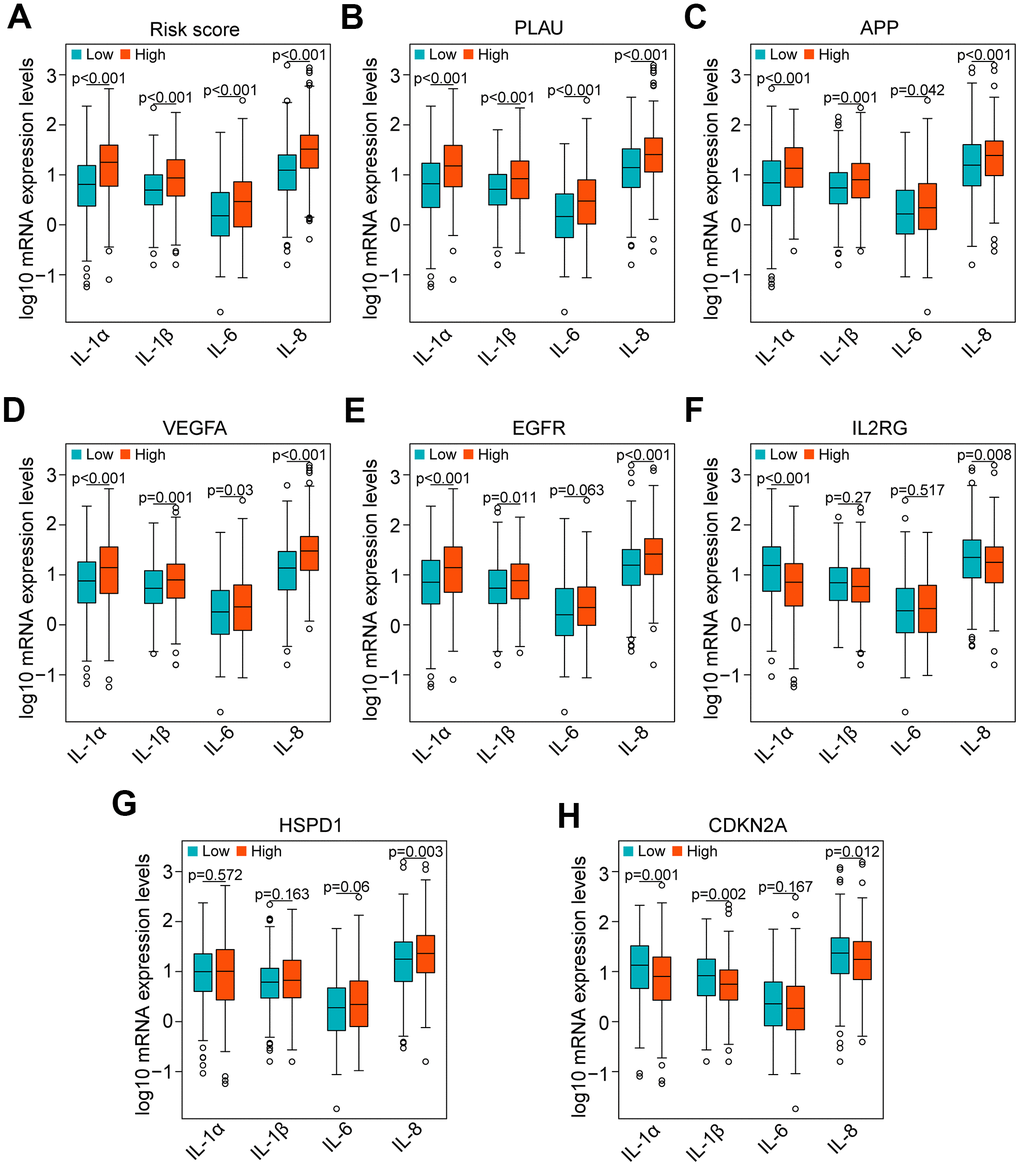
Figure 9. Correlation of proinflammatory factors with the risk score and genes of the risk model in the TCGA data set. (A) Comparison of the main proinflammatory factors (IL-1α, IL-1β, IL-6 and IL-8) between the high-risk and low-risk groups. (B–H) Distribution of the main proinflammatory factors based on high and low expression of PLAU, APP, VEGFA, EGFR, IL2RG, HSPD1 and CDKN2A.
Discussion
One key hallmark of cancer is the ability of cancer cells to evade immune destruction [26]. In the 1960s, studies showed that the aging process was associated with decreased immunological function [27–29]. Subsequently, accumulating studies have demonstrated that a chronic inflammatory microenvironment is involved in the aging process [30, 31]. Inflammation and asthenic immune surveillance with aging may facilitate tumor formation and development [9]. Currently, the role of the aging process in HNSCC is still ambiguous. Therefore, exploring the expression patterns of aging-related genes (AGs) is crucial for understanding the role of the aging process in HNSCC. Few studies have analyzed the correlation of AGs with HNSCC. Furthermore, the correlation of the expression of AGs with the prognosis of HNSCC patients has not been systematically investigated.
In this study, we initially performed a comprehensive investigation of the associations between 41 differentially expressed AGs (DEAGs, Figure 1A, 1B) and HNSCC prognosis and constructed a prognosis risk model with seven AGs, including APP, CDKN2A, EGFR, HSPD1, IL2RG, PLAU and VEGFA (Figure 1C) that revealed a robust performance signature for predicting prognosis compared to clinicopathological factors in training and multiple validation sets (Figure 3).
In the prognostic risk model, CDKN2A and IL2RG acted as protective factors, while APP, PLAU, VEGFA, EGFR and HSPD1 were risk factors (Figure 4). CDKN2A, upregulated by Lupeol, had been shown to cause cell cycle arrest at G1 phase, mediating antitumor effects in HNSCC [32]. Low CDKN2A expression predicted poor survival independently of other clinical factors in HPV-negative HNSCC [33]. IL2RG knockout mice showed immunodeficiency [34] and high tumorigenic engraftment efficiency of human cancer cells and tissues [35]. These studies are consistent with our results, suggesting that CDKN2A and IL2RG are anticancer genes. Previous studies showed that APP, a protein that originates β-amyloid that constitutes amyloid plaques, acts as one of the main pathological features of AD, one of the major aging-related diseases [36]. Interestingly, APP depletion causes cell cycle arrest in breast cancer cells and non-small cell lung cancer [37, 38]. PLAU has been identified as a biomarker of HNSCC [39], but its relationship to inflammation and immunity has not been explored. VEGFA was demonstrated to be involved in age-related macular degeneration (AMD), a leading cause of visual impairment in aging populations [40]. Indeed, VEGFA is a key molecule in various signaling pathways promoting the progression of multiple cancers [41–43]. EGFR is a biomarker in HNSCC [44] and enhances the progression of HNSCC by mediating a variety of signaling pathways [45–47]. HSPD1 was closely related to prognosis in both oral squamous cell carcinoma and breast cancer [48, 49]. Our study was the first to suggest that these factors represent a prognostic risk model of HNSCC.
Interestingly, our GSEA results revealed that B cell receptor (BCR) signaling and T cell receptor (TCR) signaling pathways were enriched in the low-risk group (Figure 6E, 6F), indicating that they may be inhibited in the high-risk group. BCR and TCR signaling is crucial for B cell and T cell proliferation and for development of adaptive immunity, and their abnormalities could lead to immunodeficiency [50–53]. For these reasons, we investigated correlation of the risk score with the immune score and the composition fraction of tumor-infiltrating immune cell types in HNSCC samples of TCGA data set. As we confirm here, there was a negative correlation between the risk score, and the immune and high-risk group contained lower fractions of naïve B cells, CD8 T cells, CD4 memory activated T cells and follicular helper T and a higher fraction of CD4 memory resting T cells compared to the low-risk group (Figure 7). Hence, our study revealed a significant correlation between a high risk score and immunosuppression and its association with the growth and differentiation of B and T cells, and high expression of PLAU, APP and EGFR were the main factors of tumor immunosuppression (Figure 8). Previous work unveiled that PLAU is particularly important for memory regulatory T cells (Tregs) [54]; however, there was no investigation of other immune cells. Based on an Alzheimer's transgenic mouse, PLAU was demonstrated as an impact factor of adaptive immunity, involved in lacking functional B and T cells [55]. The EGFR monoclonal antibody, Cetuximab, triggered immunogenic cell death [56], suggesting that EGFR plays an important role in immune cells survival. The proinflammatory factors of the senescence associated secretory phenotype (SASP) facilitate tumor immunosuppression [30, 31]. We confirmed that a high risk score was significantly associated with mRNA expression levels of IL-1α, IL-1β, IL-6 and IL-8 in HNSCC samples, and the results of PLAU, APP, VEGFA and EGFR were consistent with the results of the risk score (Figure 9).
Although we identified a prognostic risk model with seven AGs and confirmed that the risk model was significantly associated with inflammation and immunosuppression, this work has limitations. The study conducted with bioinformatics analysis was not robust enough and needs to be confirmed via experimental verification. Hence, further laboratory experiments, including a multicenter study with larger sample sizes, are needed.
In summary, in this study, we developed a robust prognostic risk model with 7 AGs. Compared to other clinical parameters, the risk score is an independent prognostic index. Furthermore, a high risk score indicates the chronic inflammatory and immunosuppressive state of HNSCC patients. Therefore, this risk model may serve as a prognostic signature and provide clues for individualized immunotherapy for HNSCC patients.
Conclusions
In conclusion, in our study, we developed a prognostic risk model with 7 differentially expressed AGs, which has great potential as an immunosuppressive and inflammatory state biomarker in HNSCC patients and provides insight into individualized immunotherapy for HNSCC patients.
Materials and Methods
Data sets
We obtained 307 human AGs from the human aging genome resource (HAGR, http://genomics.senescence.info/genes/, Supplementary Table 1). The RNA sequencing (RNA-Seq) expression profile data set was downloaded from the TCGA database (https://portal.gdc.cancer.gov/) of 500 HNSCC patients (2 duplicate patients were removed) with 44 paracarcinoma samples, and clinical information was downloaded from the cBioPortal database (https://www.cbioportal.org/). For TCGA data, 498 HNSCC patients with follow-up data were selected and randomly divided into two groups: the TCGA training set (n=298, Supplementary Table 3) and the TCGA test set (n=298, Supplementary Table 4). The GSE65858 data set as an independent verification set was obtained from the Gene Expression Omnibus (GEO) database (https://www.ncbi.nlm.nih.gov/geo/) and included RNA-Seq data and clinical information. We performed data analysis utilizing R software (version 3.6.3, https://www.r-project.org/).
Differentially expressed gene (DEG) analysis
We evaluated differentially expressed aging-related genes (DEAGs) between HNSCC and normal samples using the Wilcoxon test in the limma package. Cut-off values were adjusted with the false discovery rate (FDR) [19]. FDR < 0.05, and |log FC| value > 1 was defined as significant. Then, we constructed a hierarchical cluster heat map via the “pheatmap” package and a volcano plot to visualize the results of the DEAGs. The distribution of the DEAGs on chromosomes was visualized via the “OmicCircos” R package [20].
GO and KEGG pathway analyses
Gene Ontology (GO) and Kyoto Encyclopedia of Genes and Genomes (KEGG) pathway enrichment analyses were implemented with the “enrichplot” R package [21] to analyze the function of the DEAGs. GO terms contained biological process (BP), cellular component (CC) and molecular function (MF). For the analysis results, both P-value and false discovery rate (FDR) values < 0.05 were defined as statistically significant.
Construction of a prognostic gene signature
To identify survival-associated DEAGs, we conducted univariate Cox regression analysis. Candidate prognostic genes were selected with a threshold value of P < 0.05. Then, Lasso regression analysis in the TCGA training set was executed, and a multigene prognostic signature was constructed. The individualized risk score was calculated with the regression coefficients of each gene using the following computational formula:
where n is the number of the candidate prognostic genes, genek is the kth candidate genes, coefficient is the estimated regression coefficient of genes from the multivariate Cox regression analysis, and Expk is the expression value of the kth candidate genes. Based on the median the risk score of the TCGA training set, the HNSCC patients were divided into high-risk and low-risk groups. The association between the candidate genes and risk scores were shown by a hierarchical cluster heat map, and a nomogram containing the risk score of prognostic AGs and clinicopathological parameters was constructed via the “rms” R package.
Gene Set Enrichment Analysis
GSEA is a powerful analytical method used for estimating significant differences between two biological conditions to determine specific functional gene sets [22]. In the current study, GSEA was performed using GSEA software (v4.0.3) (https://www.gsea-msigdb.org/gsea/downloads.jsp) with the Molecular Signatures Database (MSigDB) [23] C2 curated gene sets, which generated a list of significantly different gene sets between the high-risk and low-risk groups. Each gene set was permutated 1000 times for each analysis. Gene sets with p-value < 0.05 and FDR < 0.25 were considered significantly enriched.
Evaluation of immune scores and immune cell infiltration
The ESTIMATE (Estimation of Stromal and Immune cells in Malignant Tumor tissues using Expression data) algorithm is a tool developed to evaluate immune and stromal scores in tumor samples. We calculated the immune and stromal ESTIMATE scores based on TCGA gene expression data using the “estimate” R package [24].
CIBERSORT is an analytical method used for characterizing the cellular composition of complex tissues based on gene expression profiles [25]. We conducted an estimation of the composition fraction of tumor-infiltrating immune cell types of each patient using the CIBERSORT algorithm (http://cibersort.stanford.edu/).
Statistical analysis
All statistical analyses were performed using R-3.6.3. The distribution differences among the variables were analyzed by chi-square test or Fisher’s exact test. The Kaplan-Meier curve with the log-rank test was used to estimate survival analysis. Univariate and multivariate Cox regression analyses were performed to analyze the relationship between given factors and survival in HNSCC patients. ROC curve analysis was used to evaluate the diagnostic value of the risk model. Spearman’s rank correlation test was estimated to assess the correlation between variables. P < 0.05 was identified as statistically significant.
Data Availability Statement
Expression profile datasets for this study can be accessed from The Cancer Genome Atlas (TCGA) (https://portal.gdc.cancer.gov/) and Gene Expression Omnibus (GEO) database (https://www.ncbi.nlm.nih.gov/geo/), and aging-related genes (AGs) can be retrieved from the Human Aging Genome Resources (HAGR, http://genomics.senescence.info/genes/).
Supplementary Materials
Author Contributions
Zhifeng Liu and Runliang Gan contributed to project design and final approval of the manuscript. Jing Yang, Qingshan Jiang, Lijun Liu, Hong Peng, Yaya Wang, Shuyan Li, Yanhua Tang and Jing Yu performed data analysis, interpretation, visualization and drafting.
Conflicts of Interest
All authors declare that they have no conflicts of interest.
Funding
This work was supported by grants from the Health and Family Planning Commission of Hunan Province (20201921, 20201947, B20180186), the Natural Science Foundation of Hunan Province (2019JJ50547), the Hunan Province Key Laboratory of Tumor Cellular and Molecular Pathology (2016TP1015), the Hunan Provincial Science and Technology Department (2017Sk50206) and the National Natural Science Foundation of China (81372134).
References
- 1. Bray F, Ferlay J, Soerjomataram I, Siegel RL, Torre LA, Jemal A. Global cancer statistics 2018: GLOBOCAN estimates of incidence and mortality worldwide for 36 cancers in 185 countries. CA Cancer J Clin. 2018; 68:394–424. https://doi.org/10.3322/caac.21492 [PubMed]
- 2. Cramer JD, Burtness B, Le QT, Ferris RL. The changing therapeutic landscape of head and neck cancer. Nat Rev Clin Oncol. 2019; 16:669–83. https://doi.org/10.1038/s41571-019-0227-z [PubMed]
- 3. Hill SJ, D’Andrea AD. Predictive potential of head and neck squamous cell carcinoma organoids. Cancer Discov. 2019; 9:828–30. https://doi.org/10.1158/2159-8290.CD-19-0527 [PubMed]
- 4. Siegel RL, Miller KD, Jemal A. Cancer statistics, 2020. CA Cancer J Clin. 2020; 70:7–30. https://doi.org/10.3322/caac.21590 [PubMed]
- 5. López-Otín C, Blasco MA, Partridge L, Serrano M, Kroemer G. The hallmarks of aging. Cell. 2013; 153:1194–217. https://doi.org/10.1016/j.cell.2013.05.039 [PubMed]
- 6. Lee S, Schmitt CA. The dynamic nature of senescence in cancer. Nat Cell Biol. 2019; 21:94–101. https://doi.org/10.1038/s41556-018-0249-2 [PubMed]
- 7. Baker DJ, Childs BG, Durik M, Wijers ME, Sieben CJ, Zhong J, Saltness RA, Jeganathan KB, Verzosa GC, Pezeshki A, Khazaie K, Miller JD, van Deursen JM. Naturally occurring p16(Ink4a)-positive cells shorten healthy lifespan. Nature. 2016; 530:184–89. https://doi.org/10.1038/nature16932 [PubMed]
- 8. Serrano M, Lin AW, McCurrach ME, Beach D, Lowe SW. Oncogenic ras provokes premature cell senescence associated with accumulation of p53 and p16INK4a. Cell. 1997; 88:593–602. https://doi.org/10.1016/s0092-8674(00)81902-9 [PubMed]
- 9. Kuilman T, Michaloglou C, Vredeveld LC, Douma S, van Doorn R, Desmet CJ, Aarden LA, Mooi WJ, Peeper DS. Oncogene-induced senescence relayed by an interleukin-dependent inflammatory network. Cell. 2008; 133:1019–31. https://doi.org/10.1016/j.cell.2008.03.039 [PubMed]
- 10. Coppé JP, Patil CK, Rodier F, Sun Y, Muñoz DP, Goldstein J, Nelson PS, Desprez PY, Campisi J. Senescence-associated secretory phenotypes reveal cell-nonautonomous functions of oncogenic RAS and the p53 tumor suppressor. PLoS Biol. 2008; 6:2853–68. https://doi.org/10.1371/journal.pbio.0060301 [PubMed]
- 11. Laberge RM, Zhou L, Sarantos MR, Rodier F, Freund A, de Keizer PL, Liu S, Demaria M, Cong YS, Kapahi P, Desprez PY, Hughes RE, Campisi J. Glucocorticoids suppress selected components of the senescence-associated secretory phenotype. Aging Cell. 2012; 11:569–78. https://doi.org/10.1111/j.1474-9726.2012.00818.x [PubMed]
- 12. Mahmoudi S, Xu L, Brunet A. Turning back time with emerging rejuvenation strategies. Nat Cell Biol. 2019; 21:32–43. https://doi.org/10.1038/s41556-018-0206-0 [PubMed]
- 13. Ovadya Y, Landsberger T, Leins H, Vadai E, Gal H, Biran A, Yosef R, Sagiv A, Agrawal A, Shapira A, Windheim J, Tsoory M, Schirmbeck R, et al. Impaired immune surveillance accelerates accumulation of senescent cells and aging. Nat Commun. 2018; 9:5435. https://doi.org/10.1038/s41467-018-07825-3 [PubMed]
- 14. Faget DV, Ren Q, Stewart SA. Unmasking senescence: context-dependent effects of SASP in cancer. Nat Rev Cancer. 2019; 19:439–53. https://doi.org/10.1038/s41568-019-0156-2 [PubMed]
- 15. Ko LJ, Prives C. P53: puzzle and paradigm. Genes Dev. 1996; 10:1054–72. https://doi.org/10.1101/gad.10.9.1054 [PubMed]
- 16. Henriksson M, Lüscher B. Proteins of the Myc network: essential regulators of cell growth and differentiation. Adv Cancer Res. 1996; 68:109–82. https://doi.org/10.1016/s0065-230x(08)60353-x [PubMed]
- 17. Johnson SC, Rabinovitch PS, Kaeberlein M. mTOR is a key modulator of ageing and age-related disease. Nature. 2013; 493:338–45. https://doi.org/10.1038/nature11861 [PubMed]
- 18. Tacutu R, Thornton D, Johnson E, Budovsky A, Barardo D, Craig T, Diana E, Lehmann G, Toren D, Wang J, Fraifeld VE, de Magalhães JP. Human ageing genomic resources: new and updated databases. Nucleic Acids Res. 2018; 46:D1083–90. https://doi.org/10.1093/nar/gkx1042 [PubMed]
- 19. Nakamura A, Osonoi T, Terauchi Y. Relationship between urinary sodium excretion and pioglitazone-induced edema. J Diabetes Investig. 2010; 1:208–11. https://doi.org/10.1111/j.2040-1124.2010.00046.x [PubMed]
- 20. Hu Y, Yan C, Hsu CH, Chen QR, Niu K, Komatsoulis GA, Meerzaman D. OmicCircos: a simple-to-use R package for the circular visualization of multidimensional omics data. Cancer Inform. 2014; 13:13–20. https://doi.org/10.4137/CIN.S13495 [PubMed]
- 21. Yu G, Wang LG, Han Y, He QY. clusterProfiler: an R package for comparing biological themes among gene clusters. OMICS. 2012; 16:284–87. https://doi.org/10.1089/omi.2011.0118 [PubMed]
- 22. Subramanian A, Tamayo P, Mootha VK, Mukherjee S, Ebert BL, Gillette MA, Paulovich A, Pomeroy SL, Golub TR, Lander ES, Mesirov JP. Gene set enrichment analysis: a knowledge-based approach for interpreting genome-wide expression profiles. Proc Natl Acad Sci USA. 2005; 102:15545–50. https://doi.org/10.1073/pnas.0506580102 [PubMed]
- 23. Liberzon A, Subramanian A, Pinchback R, Thorvaldsdóttir H, Tamayo P, Mesirov JP. Molecular signatures database (MSigDB) 3.0. Bioinformatics. 2011; 27:1739–40. https://doi.org/10.1093/bioinformatics/btr260 [PubMed]
- 24. Yoshihara K, Shahmoradgoli M, Martínez E, Vegesna R, Kim H, Torres-Garcia W, Treviño V, Shen H, Laird PW, Levine DA, Carter SL, Getz G, Stemke-Hale K, et al. Inferring tumour purity and stromal and immune cell admixture from expression data. Nat Commun. 2013; 4:2612. https://doi.org/10.1038/ncomms3612 [PubMed]
- 25. Newman AM, Liu CL, Green MR, Gentles AJ, Feng W, Xu Y, Hoang CD, Diehn M, Alizadeh AA. Robust enumeration of cell subsets from tissue expression profiles. Nat Methods. 2015; 12:453–57. https://doi.org/10.1038/nmeth.3337 [PubMed]
- 26. Hanahan D, Weinberg RA. Hallmarks of cancer: the next generation. Cell. 2011; 144:646–74. https://doi.org/10.1016/j.cell.2011.02.013 [PubMed]
- 27. Mackay IR. Ageing and immunological function in man. Gerontologia. 1972; 18:285–304. https://doi.org/10.1159/000211941 [PubMed]
- 28. Inkeles B, Innes JB, Kuntz MM, Kadish AS, Weksler ME. Immunological studies of aging. Iii. Cytokinetic basis for the impaired response of lymphocytes from aged humans to plant lectins. J Exp Med. 1977; 145:1176–87. https://doi.org/10.1084/jem.145.5.1176 [PubMed]
- 29. Roder JC, Duwe AK, Bell DA, Singhal SK. Immunological senescence. I. The role of suppressor cells. Immunology. 1978; 35:837–47. [PubMed]
- 30. Franceschi C, Bonafè M, Valensin S, Olivieri F, De Luca M, Ottaviani E, De Benedictis G. Inflamm-aging. An evolutionary perspective on immunosenescence. Ann N Y Acad Sci. 2000; 908:244–54. https://doi.org/10.1111/j.1749-6632.2000.tb06651.x [PubMed]
- 31. Franceschi C, Garagnani P, Parini P, Giuliani C, Santoro A. Inflammaging: a new immune-metabolic viewpoint for age-related diseases. Nat Rev Endocrinol. 2018; 14:576–90. https://doi.org/10.1038/s41574-018-0059-4 [PubMed]
- 32. Bhattacharyya S, Sekar V, Majumder B, Mehrotra DG, Banerjee S, Bhowmick AK, Alam N, Mandal GK, Biswas J, Majumder PK, Murmu N. CDKN2A-p53 mediated antitumor effect of lupeol in head and neck cancer. Cell Oncol (Dordr). 2017; 40:145–55. https://doi.org/10.1007/s13402-016-0311-7 [PubMed]
- 33. Chen WS, Bindra RS, Mo A, Hayman T, Husain Z, Contessa JN, Gaffney SG, Townsend JP, Yu JB. CDKN2A copy number loss is an independent prognostic factor in HPV-negative head and neck squamous cell carcinoma. Front Oncol. 2018; 8:95. https://doi.org/10.3389/fonc.2018.00095 [PubMed]
- 34. Byambaa S, Uosaki H, Hara H, Nagao Y, Abe T, Shibata H, Nureki O, Ohmori T, Hanazono Y. Generation of novel Il2rg-knockout mice with clustered regularly interspaced short palindromic repeats (CRISPR) and Cas9. Exp Anim. 2020; 69:189–98. https://doi.org/10.1538/expanim.19-0120 [PubMed]
- 35. Zhou Q, Facciponte J, Jin M, Shen Q, Lin Q. Humanized NOD-SCID IL2rg–/– mice as a preclinical model for cancer research and its potential use for individualized cancer therapies. Cancer Lett. 2014; 344:13–19. https://doi.org/10.1016/j.canlet.2013.10.015 [PubMed]
- 36. Galvão F
Jr , Grokoski KC, da Silva BB, Lamers ML, Siqueira IR. The amyloid precursor protein (APP) processing as a biological link between Alzheimer’s disease and cancer. Ageing Res Rev. 2019; 49:83–91. https://doi.org/10.1016/j.arr.2018.11.007 [PubMed] - 37. Lim S, Yoo BK, Kim HS, Gilmore HL, Lee Y, Lee HP, Kim SJ, Letterio J, Lee HG. Amyloid-β precursor protein promotes cell proliferation and motility of advanced breast cancer. BMC Cancer. 2014; 14:928. https://doi.org/10.1186/1471-2407-14-928 [PubMed]
- 38. Sobol A, Galluzzo P, Weber MJ, Alani S, Bocchetta M. Depletion of amyloid precursor protein (APP) causes G0 arrest in non-small cell lung cancer (NSCLC) cells. J Cell Physiol. 2015; 230:1332–41. https://doi.org/10.1002/jcp.24875 [PubMed]
- 39. Yang K, Zhang S, Zhang D, Tao Q, Zhang T, Liu G, Liu X, Zhao T. Identification of SERPINE1, PLAU and ACTA1 as biomarkers of head and neck squamous cell carcinoma based on integrated bioinformatics analysis. Int J Clin Oncol. 2019; 24:1030–41. https://doi.org/10.1007/s10147-019-01435-9 [PubMed]
- 40. Zhao L, Grob S, Avery R, Kimura A, Pieramici D, Lee J, Rabena M, Ortiz S, Quach J, Cao G, Luo H, Zhang M, Pei M, et al. Common variant in VEGFA and response to anti-VEGF therapy for neovascular age-related macular degeneration. Curr Mol Med. 2013; 13:929–34. https://doi.org/10.2174/15665240113139990048 [PubMed]
- 41. Wang LL, Zong ZH, Liu Y, Guan X, Chen S, Zhao Y. CircRhoC promotes tumorigenicity and progression in ovarian cancer by functioning as a miR-302e sponge to positively regulate VEGFA. J Cell Mol Med. 2019; 23:8472–81. https://doi.org/10.1111/jcmm.14736 [PubMed]
- 42. Zhang Q, Lu S, Li T, Yu L, Zhang Y, Zeng H, Qian X, Bi J, Lin Y. ACE2 inhibits breast cancer angiogenesis via suppressing the VEGFa/VEGFR2/ERK pathway. J Exp Clin Cancer Res. 2019; 38:173. https://doi.org/10.1186/s13046-019-1156-5 [PubMed]
- 43. Wu H, Wei M, Jiang X, Tan J, Xu W, Fan X, Zhang R, Ding C, Zhao F, Shao X, Zhang Z, Shi R, Zhang W, Wu G. lncRNA PVT1 promotes tumorigenesis of colorectal cancer by stabilizing miR-16-5p and interacting with the VEGFA/VEGFR1/AKT axis. Mol Ther Nucleic Acids. 2020; 20:438–50. https://doi.org/10.1016/j.omtn.2020.03.006 [PubMed]
- 44. Beck TN, Georgopoulos R, Shagisultanova EI, Sarcu D, Handorf EA, Dubyk C, Lango MN, Ridge JA, Astsaturov I, Serebriiskii IG, Burtness BA, Mehra R, Golemis EA. EGFR and RB1 as dual biomarkers in HPV-negative head and neck cancer. Mol Cancer Ther. 2016; 15:2486–97. https://doi.org/10.1158/1535-7163.MCT-16-0243 [PubMed]
- 45. Barzegar M, Ma S, Zhang C, Chen X, Gu Y, Shang C, Jiang X, Yang J, Nathan CA, Yang S, Huang S. SKLB188 inhibits the growth of head and neck squamous cell carcinoma by suppressing EGFR signalling. Br J Cancer. 2017; 117:1154–63. https://doi.org/10.1038/bjc.2017.298 [PubMed]
- 46. Nottingham LK, Yan CH, Yang X, Si H, Coupar J, Bian Y, Cheng TF, Allen C, Arun P, Gius D, Dang L, Van Waes C, Chen Z. Aberrant IKKα and IKKβ cooperatively activate NF-κB and induce EGFR/AP1 signaling to promote survival and migration of head and neck cancer. Oncogene. 2014; 33:1135–47. https://doi.org/10.1038/onc.2013.49 [PubMed]
- 47. Wang D, Su L, Huang D, Zhang H, Shin DM, Chen ZG. Downregulation of E-cadherin enhances proliferation of head and neck cancer through transcriptional regulation of EGFR. Mol Cancer. 2011; 10:116. https://doi.org/10.1186/1476-4598-10-116 [PubMed]
- 48. Kang BH, Shu CW, Chao JK, Lee CH, Fu TY, Liou HH, Ger LP, Liu PF. HSPD1 repressed E-cadherin expression to promote cell invasion and migration for poor prognosis in oral squamous cell carcinoma. Sci Rep. 2019; 9:8932. https://doi.org/10.1038/s41598-019-45489-1 [PubMed]
- 49. Kim SK, Kim K, Ryu JW, Ryu TY, Lim JH, Oh JH, Min JK, Jung CR, Hamamoto R, Son MY, Kim DS, Cho HS. The novel prognostic marker, EHMT2, is involved in cell proliferation via HSPD1 regulation in breast cancer. Int J Oncol. 2019; 54:65–76. https://doi.org/10.3892/ijo.2018.4608 [PubMed]
- 50. Takeuchi Y, Hirota K, Sakaguchi S. Impaired T cell receptor signaling and development of T cell-mediated autoimmune arthritis. Immunol Rev. 2020; 294:164–76. https://doi.org/10.1111/imr.12841 [PubMed]
- 51. Burger JA, Wiestner A. Targeting B cell receptor signalling in cancer: preclinical and clinical advances. Nat Rev Cancer. 2018; 18:148–67. https://doi.org/10.1038/nrc.2017.121 [PubMed]
- 52. Berry CT, Liu X, Myles A, Nandi S, Chen YH, Hershberg U, Brodsky IE, Cancro MP, Lengner CJ, May MJ, Freedman BD. BCR-induced Ca2+ signals dynamically tune survival, metabolic reprogramming, and proliferation of naive B cells. Cell Rep. 2020; 31:107474. https://doi.org/10.1016/j.celrep.2020.03.038 [PubMed]
- 53. Zikherman J, Parameswaran R, Weiss A. Endogenous antigen tunes the responsiveness of naive B cells but not T cells. Nature. 2012; 489:160–64. https://doi.org/10.1038/nature11311 [PubMed]
- 54. He F, Chen H, Probst-Kepper M, Geffers R, Eifes S, Del Sol A, Schughart K, Zeng AP, Balling R. PLAU inferred from a correlation network is critical for suppressor function of regulatory T cells. Mol Syst Biol. 2012; 8:624. https://doi.org/10.1038/msb.2012.56 [PubMed]
- 55. Späni C, Suter T, Derungs R, Ferretti MT, Welt T, Wirth F, Gericke C, Nitsch RM, Kulic L. Reduced β-amyloid pathology in an APP transgenic mouse model of Alzheimer’s disease lacking functional B and T cells. Acta Neuropathol Commun. 2015; 3:71. https://doi.org/10.1186/s40478-015-0251-x [PubMed]
- 56. Pozzi C, Cuomo A, Spadoni I, Magni E, Silvola A, Conte A, Sigismund S, Ravenda PS, Bonaldi T, Zampino MG, Cancelliere C, Di Fiore PP, Bardelli A, et al. The EGFR-specific antibody cetuximab combined with chemotherapy triggers immunogenic cell death. Nat Med. 2016; 22:624–31. https://doi.org/10.1038/nm.4078 [PubMed]