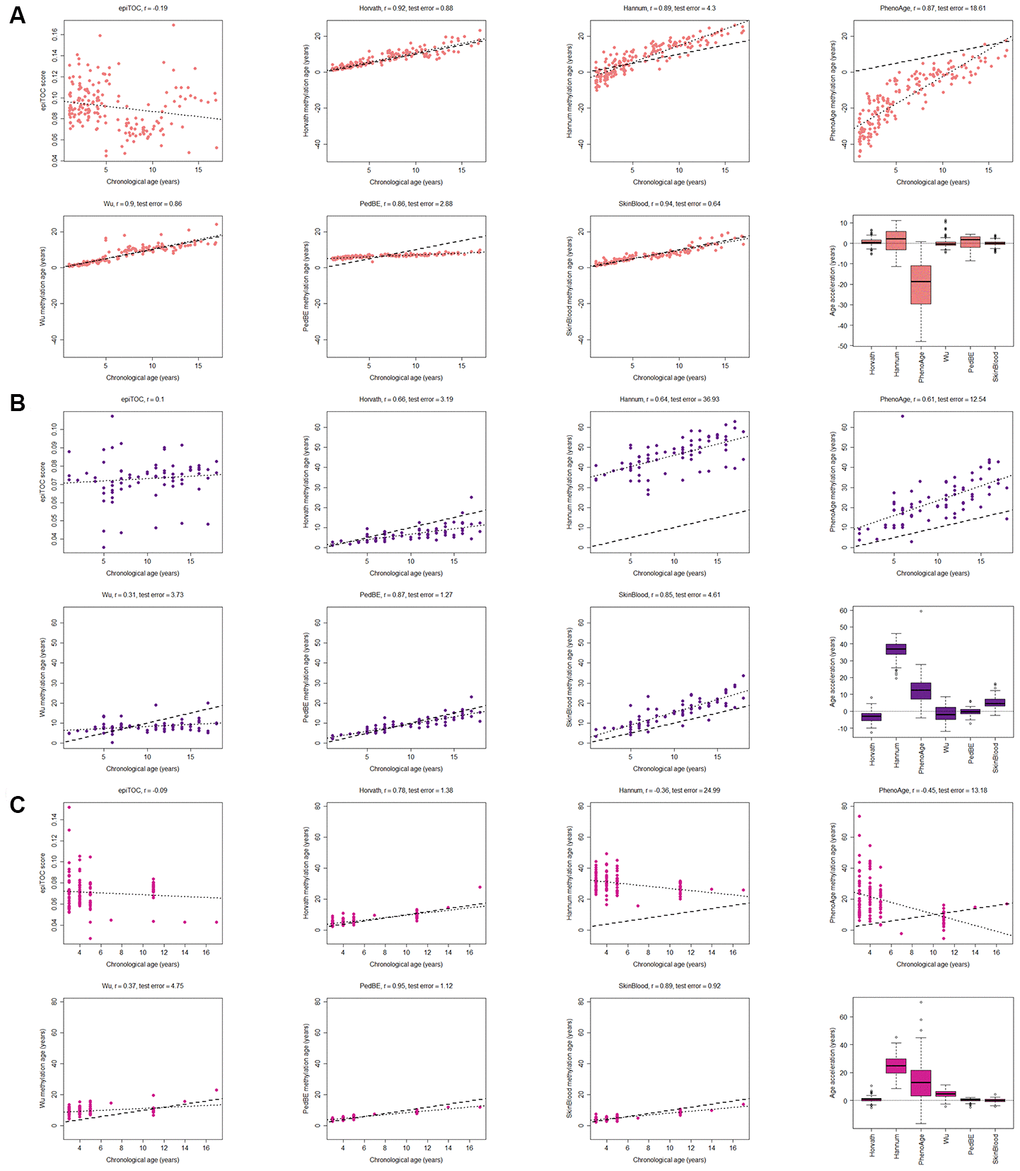
Figure 1.Evaluation of seven methylation clocks in three tissues from healthy children. (A) Comparison of seven methylation clocks in blood samples (n = 188) from healthy children with estimated methylation age (y-axis) vs chronological age (x-axis). The dashed line represents y=x (i.e. the estimated methylation age is the same as the chronological age), and the dotted line shows the chronological age to methylation age regression line. Pearson correlation between the methylation age and chronological age is indicated as r above each sub figure together with test error, which we define as the median difference in years between the methylation age and chronological age. The boxplots display age acceleration = methylation age – chronological age. The epiTOC score is calculated as an average Beta value over a set of 385 CpG sites which cannot be translated into an age estimate in years and we have therefore chosen to not include it in the boxplots or to display the dotted line or calculate the test error. (B) The performance of the seven clocks in buccal (n = 72) and (C) saliva (n=121) samples from healthy children.