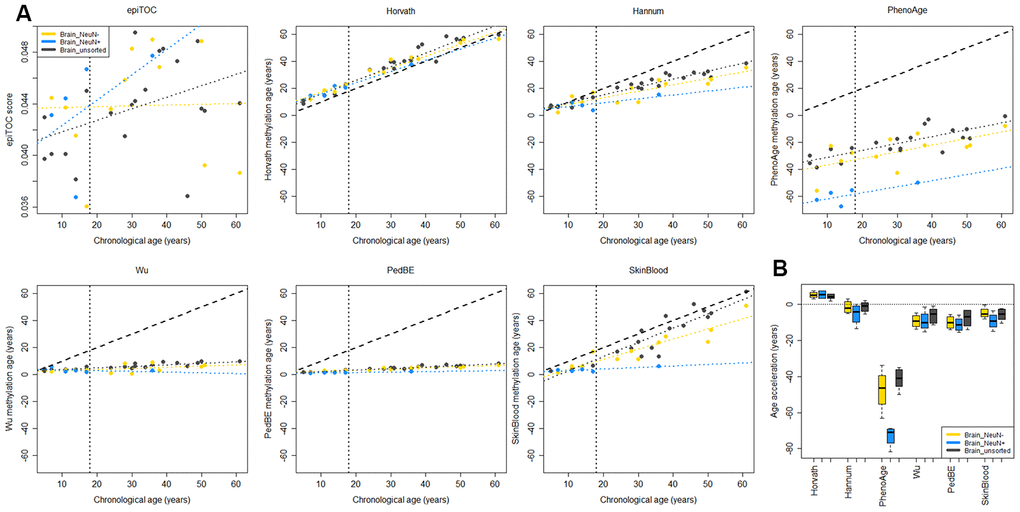
Figure 3.Comparison of methylation clocks for sorted brain cells. (A) The seven methylation clocks applied on matched samples from six children (≤18 years old) and 15 adults (separated by the vertical dotted line). Samples include unsorted brain tissue, and FACS sorted cells that are positive (NeuN+) and negative (NeuN-) respectively for a neuronal marker. The dashed diagonal line shows y=x, a perfect correlation between methylation age and chronological age, for reference, and the diagonal dotted lines display the regression lines of chronological age to methylation age for the three sample types. (B) Boxplot of age acceleration for the three sample types for the pediatric samples (boxplot for adult samples in Supplementary Figure 4). For the PhenoAge methylation clock, the NeuN+ cells have significantly lower age acceleration than NeuN- (adj. p = 0.024) and unsorted brain (adj. p = 0.0003).