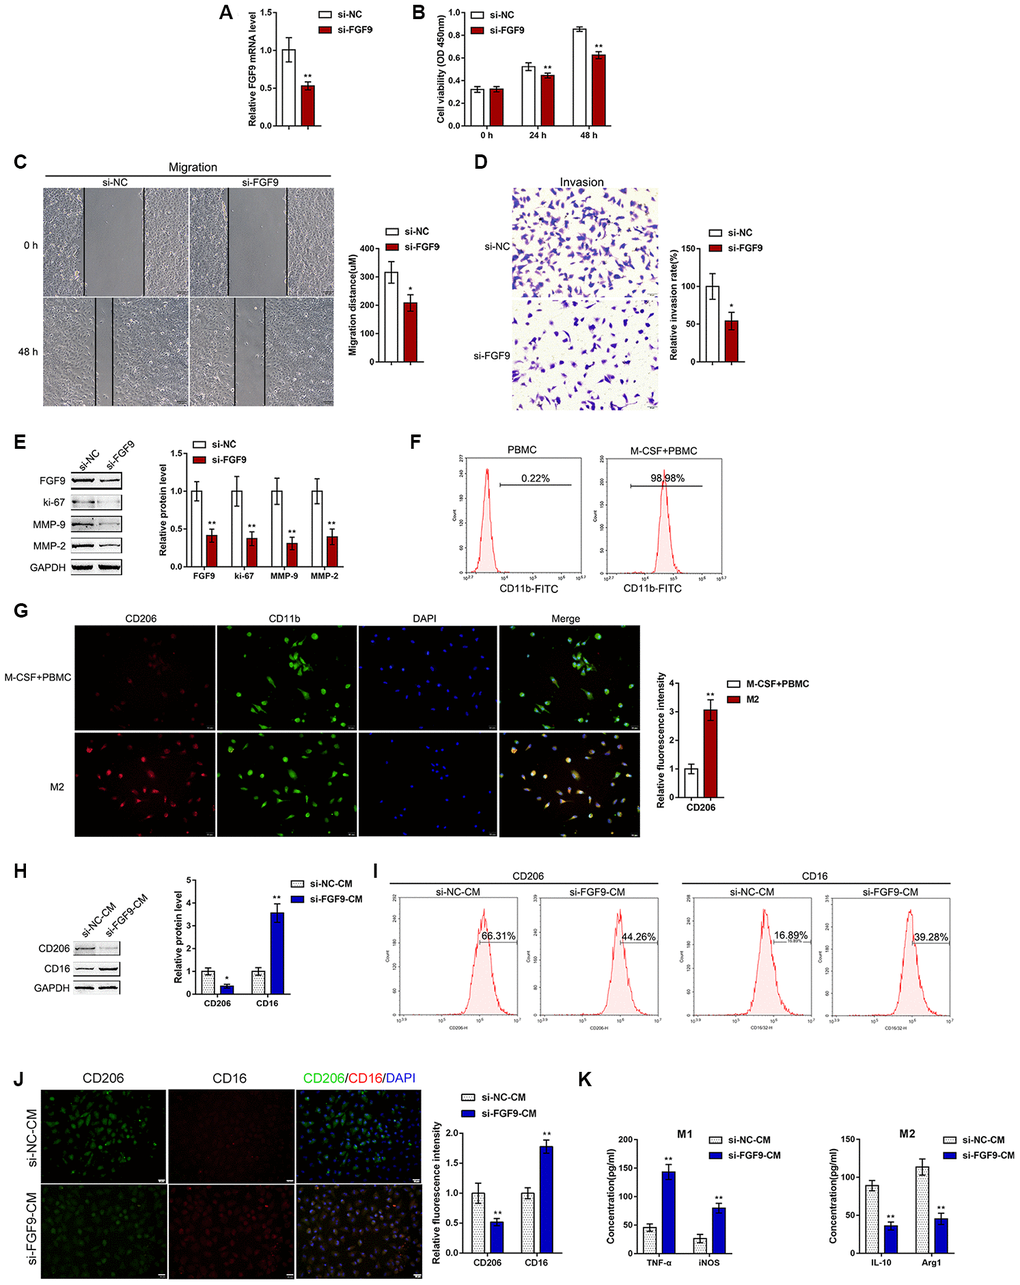
Figure 2.Effects of FGF9 on bladder cancer cell aggressiveness and macrophage M2 polarization. (A) FGF9 knockdown was generated in the T24 bladder cancer cell line by transfection of si-FGF9. The transfection efficiency was validated by real-time PCR. P<0.01, student’s T test. Next, T24 cells were transfected with si-FGF9 and examined for (B) cell viability by MTT assay; **P<0.01, one-way ANOVA test. (C) migration capacity by wound healing assay; P<0.05, student’s T test. (D) the invasive capacity by Transwell assay, P<0.05, student’s T test.; and (E) protein levels of FGF9, ki-67, MMP-2, and MMP-9 by immunoblotting. **P<0.01, student’s T test. (F) Monocytes were isolated from peripheral blood (PBMCs) and treated with 50 ng/ml M-CSF to stimulate the monocyte differentiation into macrophages (M0). The M0 macrophages were identified as CD11b positive by flow cytometry. (G) M0 macrophages were then stimulated with 20 ng/ml IL-4 (eBioscience) for two days to induce M2 polarization and authenticated using IF staining with anti-CD11b and anti-CD206 antibodies. The inflorescence intensity is shown in the right panel. P<0.01, student’s T test. (H–K) Next, T24 cells were transfected with si-FGF9 or si-NC (negative control) and the culture medium (shown in the figures as conditioned medium, si-NC-CM and si-FGF9-CM) was collected for macrophage incubation. M0 macrophages were divided into four groups: IL-4 (M2 polarization inducing) + si-NC-CM, IL-4 (M2 polarization inducing) + si-FGF9-CM, LPS + IFNγ (M1 polarization inducing) + si-NC-CM, and LPS + IFNγ (M1 polarization inducing) + si-FGF9-CM, and examined for (H) the protein levels of CD206 and CD16 by immunoblotting. P<0.05 or P<0.01, student’s T test.; (I) the percentage of CD206 and CD16 positive cells was determined by flow cytometry; (J) the inflorescence intensity of CD206 and CD16 was measured by IF staining. The inflorescence intensity is shown in the right panel. P<0.01, student’s T test. (K) The concentrations of IL-10, Arg1, iNOS, and TNF-α in the culture medium was determined by ELISA. **P<0.01, student’s T test.