


Introduction
Bladder cancer is one of the most serious malignancies in the world [1]. At the first diagnosis, nearly three-quarters of bladder cancer patients are diagnosed with NMIBC (non-muscle invasive bladder cancer), while approximately a quarter of the patients have MIBC (muscle invasive bladder cancer) [2, 3]. Although MIBC only accounts for the minority of bladder cancers, disease-specific and overall survival rates are generally recognized to be lower in patients with MIBC [4, 5], with an overall five-year survival rate of 30–50% [3]. Maximal transurethral resection with chemoradiotherapy is the most common therapeutic strategy for bladder cancer [6]. However, MIBC is considered a highly lethal disease and it requires neoadjuvant treatment; therefore, comparing the differences between MIBC and NMIBC might provide some strategies for developing improved neoadjuvant treatment.
The tumor microenvironment (TME) is the environment around a tumor, and consists of tumor cells, stroma and infiltrating immune cells. Immune cells within the tumor microenvironment could play a role in inhibiting or promoting cancers [7]. Both CD8+ T cells and NKs (natural killer cells) can mediate anticancer effects, while tumor-related macrophages and regulatory T cells act as tumor promoters [8, 9]. Macrophages are critical players in the innate and adaptive immune systems. The latest classification of macrophage functional types comprises classically activated (M1) macrophages with pro-inflammatory activity and alternatively activated (M2) macrophages, with anti-inflammatory functions [10]. There is growing evidence that M2 macrophages can accelerate tumor progression and metastasis [8, 11, 12]. In bladder cancer, M2 or alternatively polarized macrophages are associated with poorer prognosis [13]. Thus, it is speculated that M2 macrophages can possibly serve as immunotherapeutic targets for the treatment of MIBC [12]. The accelerating effect of M2 macrophages on tumor progression and metastasis are mediated through complex cross-talk mechanisms by which cancer cells act on tumor-associated macrophages, and vice versa. However, the precise mechanisms by which bladder cancer cells reeducate resident macrophages to elicit this polarization program remain elusive.
Over the past few decades, high-throughput biometric technology has been applied in cancer research to determine the critical biomarkers capable of facilitating discovery and translation [14, 15]. Currently, we can perform advanced bioinformatic analysis to address aberrant gene expression and critical signaling pathways, thus providing multiple clinical assessments for the research of bladder cancer [16]. Fibroblast growth factor 9 (FGF9) has been reported to enhance M2 macrophage polarization in the infarcted diabetic heart [17] while M2 macrophages are the main type of bladder cancer-related macrophages and can accelerate bladder cancer progression [18, 19]. In cancers, FGF9 overexpression accelerates lung adenocarcinoma [20]. Notably, GSE77952 analysis identified FGF9 as a significantly upregulated gene in MIBC, in comparison with NMIBC; thus, investigating the effect of FGF9 on macrophage M2 polarization in bladder cancer and the potential mechanism could be suggested as a new strategy to treat MIBC.
As high throughput sequencing technologies evolve, it has been found that less than 2% of the transcripts encode proteins, whereas the rest are transcribed as ncRNAs (noncoding RNAs), which include miRNAs and lncRNAs (long noncoding RNAs) [21]. LncRNAs contribute to chromatin remodeling, RNA decay, epigenetic modulation, chromatin modification and many other cell functions [22, 23], by transcriptionally and posttranscriptionally affecting gene expression. In doing so, lncRNAs modulate tumor formation, invasion and metastasis [24, 25]. Notably, several lncRNAs have been reported to regulate macrophage M2 polarization in cancers. LncRNA GAS5 suppresses transcription of TRF4, a critical factor for modulating the polarization of M2 macrophages, thus inhibiting M2 polarization in demyelinating diseases [26]. LncRNA KCNQ1OT1 can suppress miR-21a-5p to induce the polarization of macrophages, thus improving particle-induced osteolysis [27]. In endometrial cancer, lncRNA NIFK-AS1 inhibits macrophage M2 polarization by targeting miR-146a [28]. Since many lncRNAs are deregulated in bladder cancer, we hypothesized that lncRNAs might also modulate macrophage M2 polarization, therefore affecting bladder cancer cell aggressiveness. In addition, the mechanism might be related to miRNAs.
Herein, we first examined FGF9 expression and protein levels in MIBC and NMIBC tissue samples; in addition, the protein content and distribution of the M2 marker CD163 were examined in the same samples using immunofluorescence (IF) staining. FGF9 was knocked down and the specific effects of FGF9 knockdown on bladder cancer cell aggressiveness and the M2 polarization of macrophages cultured in FGF9 knockdown cancer cell culture medium were determined. Next, differentially expressed lncRNAs related to FGF9 were analyzed, and LINC01140 was selected; the roles of LINC01140 in the aggressiveness of bladder cancer cells and the M2 polarization of macrophages cultured in cancer cell culture medium were determined. Finally, we analyzed miRNAs that might simultaneously target LINC01140 and FGF9 and selected miR-140-5p; the dynamic effects of LINC01140 and miR-140-5p on FGF9 expression, bladder cancer cell aggressiveness and the M2 polarization of macrophages cultured in cancer cell culture medium were determined. In summary, we identified a lncRNA-miRNA-mRNA axis modulating the macrophage M2 polarization, therefore affecting bladder cancer cell aggressiveness.
Results
Expression of FGF9 in MIBC (muscular invasive bladder cancer) and NMIBC (non-muscular invasive bladder cancer) tissues
To identify factors involved in MIBC pathogenesis, we analyzed an online microarray expression profile (GSE77952) reporting the differentially-expressed genes in tissues between 14 cases of MIBC and 16 cases of NMIBC; in the MIBC tissues, FGF9 expression was obviously upregulated (p=0.0070, Figure 1A). According to TCGA data, higher expression of FGF9 was correlated with poorer overall survival in bladder carcinoma patients (Hazard ratio = 1.900 (95% CI = 1.079-3.345), logrank P = 0.0213, Figure 1B). Thus, FGF9 was selected for further experiments.
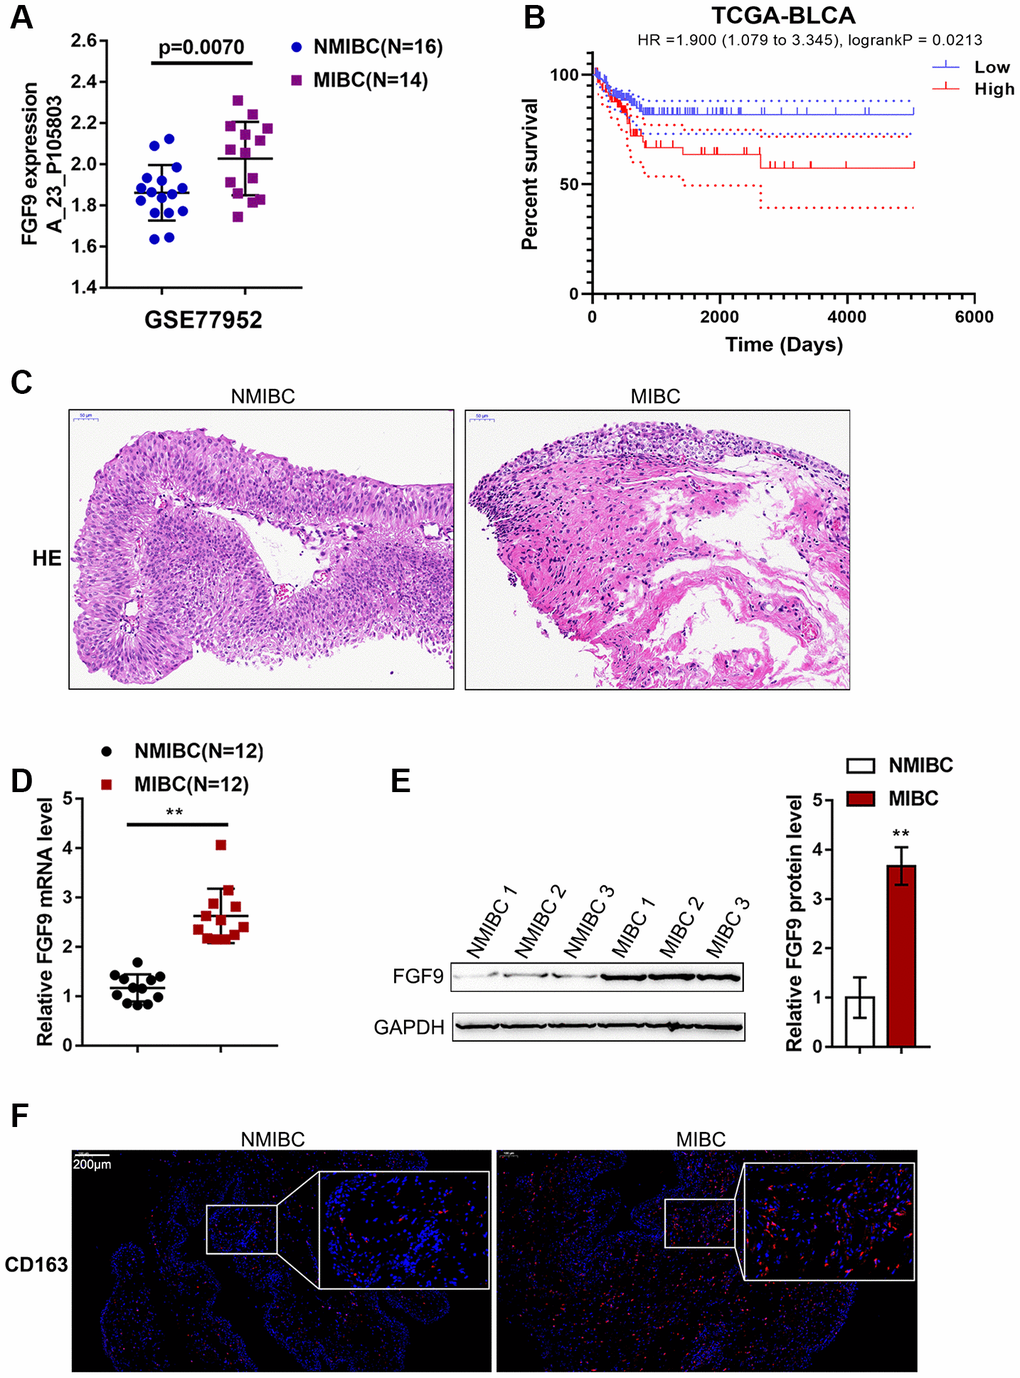
Figure 1. Expression of FGF9 in muscular invasive bladder cancer (MIBC) and non-muscular invasive bladder cancer (NMIBC) tissues. (A) The expression of FGF9 in MIBC and NMIBC tissues based on the data from GSE77952. P=0.007, student’s T test. (B) The overall survival of patients with bladder cancer was analyzed by grouping the samples based on FGF9 expression using log-rank test. Data are based on TCGA database. (C) The pathological changes in MIBC and NMIBC tissues was shown by H&E staining. (D) The expression of FGF9 in tissues of 12 cases of MIBC and 12 cases of NMIBC was determined using real-time PCR. P<0.01, paired student’s T test. (E) The protein levels of FGF9 in tissues of 12 cases of MIBC and 12 cases of NMIBC were determined using immunoblotting. P<0.01, paired student’s T test. (F) The protein distribution of CD163 (M2 macrophage marker) was determined in MIBC and NMIBC tissues using immunofluorescence (IF) staining.
Next, we collected 12 MIBC and NMIBC tissues, and the H&E staining results are shown in Figure 1C. Then, the expression of FGF9 in the tissues of 12 cases of MIBC and 12 cases of NMIBC was monitored using real-time PCR. Consistent with online data, the expression of FGF9 was dramatically upregulated in MIBC tissue samples compared with NMIBC tissue samples (Figure 1D). Immunoblotting analysis showed that FGF9 protein contents were increased within MIBC tissue samples compared with NMIBC tissue samples (Figure 1E). The protein content and distribution of CD163 (M2 macrophage marker) were determined in MIBC and NMIBC tissues using immunofluorescence (IF) staining; notably, the results showed that CD163-positive cells were more frequently observed in MIBC samples (Figure 1F). These data suggest that FGF9 is overexpressed in bladder cancer, especially in MIBC. In addition, M2 macrophages account for a greater proportion of macrophages in MIBC. Thus, we speculate that FGF9 might promote bladder cancer development, possibly by promoting macrophage M2 polarization.
Effects of FGF9 on bladder cancer cell aggressiveness and macrophage M2 polarization
To validate the hypothesis, we transfected si-FGF9 into T24 cells to generate FGF9 knockdown T24 bladder cancer cells, and performed real-time PCR (Figure 2A) and immunoblotting (Figure 2E) to verify the transfection efficiency. After knocking down FGF9 in T24 cells, cell viability, migration capacity, and invasive capacity were all significantly inhibited (Figure 2B-D). We further confirmed that the protein levels of the proliferation marker ki-67 and extracellular matrix markers MMP-2 and MMP-9 were also significantly decreased (Figure 2E). Thus, knocking down FGF9 significantly inhibits the aggressiveness of bladder carcinoma cells.
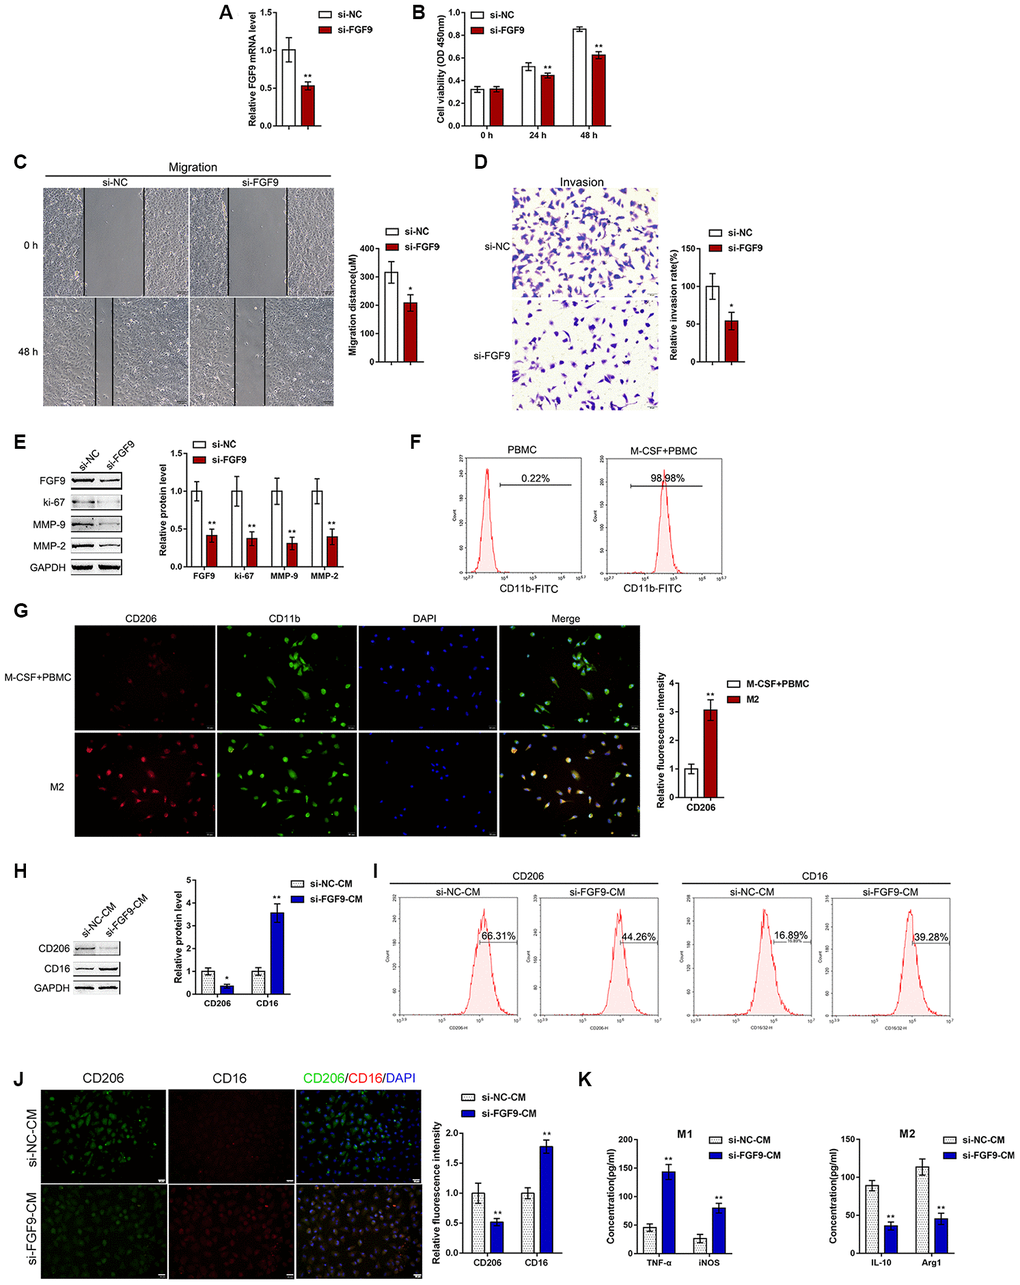
Figure 2. Effects of FGF9 on bladder cancer cell aggressiveness and macrophage M2 polarization. (A) FGF9 knockdown was generated in the T24 bladder cancer cell line by transfection of si-FGF9. The transfection efficiency was validated by real-time PCR. P<0.01, student’s T test. Next, T24 cells were transfected with si-FGF9 and examined for (B) cell viability by MTT assay; **P<0.01, one-way ANOVA test. (C) migration capacity by wound healing assay; P<0.05, student’s T test. (D) the invasive capacity by Transwell assay, P<0.05, student’s T test.; and (E) protein levels of FGF9, ki-67, MMP-2, and MMP-9 by immunoblotting. **P<0.01, student’s T test. (F) Monocytes were isolated from peripheral blood (PBMCs) and treated with 50 ng/ml M-CSF to stimulate the monocyte differentiation into macrophages (M0). The M0 macrophages were identified as CD11b positive by flow cytometry. (G) M0 macrophages were then stimulated with 20 ng/ml IL-4 (eBioscience) for two days to induce M2 polarization and authenticated using IF staining with anti-CD11b and anti-CD206 antibodies. The inflorescence intensity is shown in the right panel. P<0.01, student’s T test. (H–K) Next, T24 cells were transfected with si-FGF9 or si-NC (negative control) and the culture medium (shown in the figures as conditioned medium, si-NC-CM and si-FGF9-CM) was collected for macrophage incubation. M0 macrophages were divided into four groups: IL-4 (M2 polarization inducing) + si-NC-CM, IL-4 (M2 polarization inducing) + si-FGF9-CM, LPS + IFNγ (M1 polarization inducing) + si-NC-CM, and LPS + IFNγ (M1 polarization inducing) + si-FGF9-CM, and examined for (H) the protein levels of CD206 and CD16 by immunoblotting. P<0.05 or P<0.01, student’s T test.; (I) the percentage of CD206 and CD16 positive cells was determined by flow cytometry; (J) the inflorescence intensity of CD206 and CD16 was measured by IF staining. The inflorescence intensity is shown in the right panel. P<0.01, student’s T test. (K) The concentrations of IL-10, Arg1, iNOS, and TNF-α in the culture medium was determined by ELISA. **P<0.01, student’s T test.
To validate the effects of FGF9 on macrophage M2 polarization in bladder cancer, we isolated monocytes from peripheral blood (PBMCs) and stimulated the monocytes with 50 ng/ml M-CSF for polarization induction. The macrophages were identified as CD11b positive by flow cytometry (Figure 2F). The polarized M2 macrophages were identified by IF for CD11b and CD206 expression. The results showed that the inflorescence intensity of CD206 expression was dramatically increased after M2 polarization (Figure 2G). Next, T24 cells were transfected with si-FGF9 or si-NC (negative control) and the culture medium (shown in the figures as conditioned medium si-NC-CM and si-FGF9-CM) was collected for macrophage incubation. M0 macrophages were divided into four groups: IL-4 (M2 polarization inducing) + si-NC-CM, IL-4 (M2 polarization inducing) + si-FGF9-CM, LPS + IFNγ (M1 polarization inducing) + si-NC-CM, and LPS + IFNγ (M1 polarization inducing) + si-FGF9-CM, and then the M1/M2 polarization markers were examined. Under M2 polarization conditions, culture with si-FGF9-CM significantly decreased the protein levels of M2 macrophage marker CD206 while increasing the M1 macrophage marker CD16 (Figure 2H). Moreover, the flow cytometry results and IF results further confirmed that si-FGF9-CM decreased the percentage of CD206 positive cells and CD206 fluorescence intensity while increasing the percentage of CD16 positive cells and CD16 fluorescence intensity (Figure 2I, 2J). ELISA also revealed that the concentrations of the M2 markers IL-10 and Arg1 were increased in si-FGF9-CM treated cells and that the concentrations of M1 markers iNOS and TNF-α were decreased in si-FGF9-CM treated cells (Figure 2K). These data indicate that FGF9 knockdown in bladder cancer cells could attenuate the macrophage M2 polarization in through the cancer microenvironment.
Expression of the lncRNA LINC01140 in NMIBC and MIBC tissues
Considering that lncRNAs exert an essential effect on macrophage polarization and carcinogenesis [29–31], next, we analyzed GSE77952 to identify differentially- expressed lncRNAs that might be related to MIBC development. By analyzing the correlation between FGF9 and differentially- expressed lncRNAs, the study demonstrated that lncRNA LINC01140 expression had a significant correlation with FGF9 (data not shown) and was upregulated in MIBC tissues (p=0.0295, Figure 3A). In addition, based on TCGA data, higher expression of FGF9 was also associated with worse overall survival in bladder carcinoma patients (Hazard ratio = 3.168 (95% CI = 1.750-5.735), logrank P = 2.355e -05, Figure 3B).
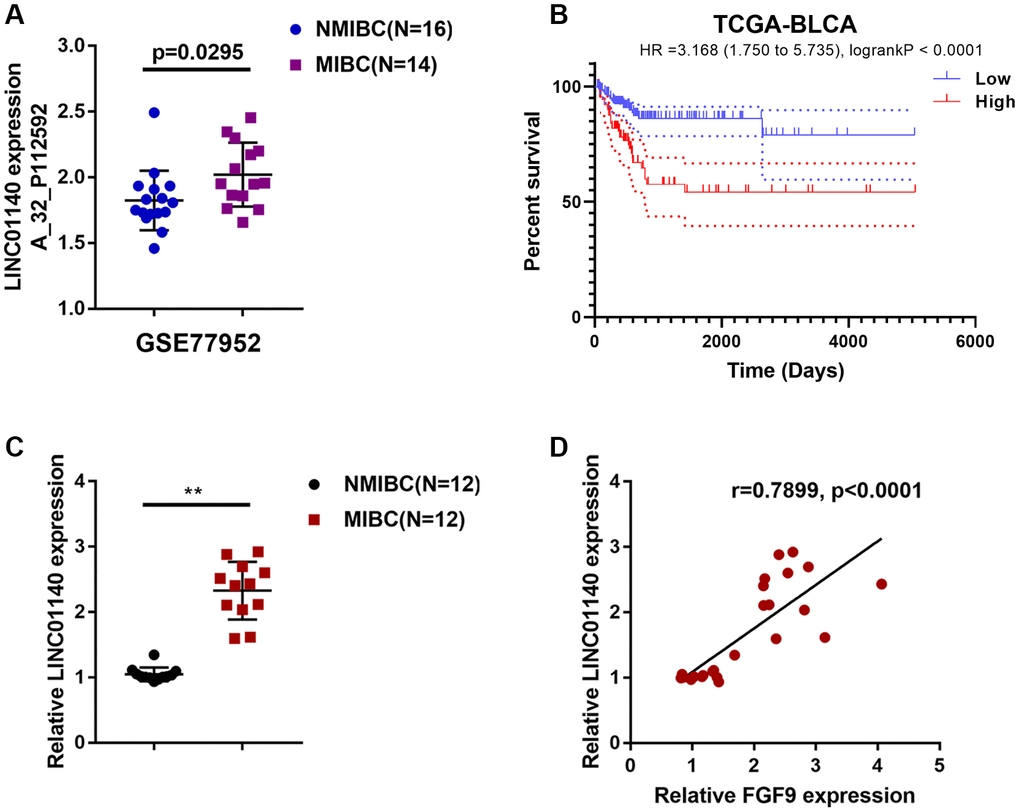
Figure 3. Expression of lncRNA LINC01140 in NMIBC and MIBC tissues. (A) The expression of lncRNA LINC01140 in MIBC and NMIBC tissues based on the data from GSE77952. P=0.0295, student’s T test. (B) The overall survival of patients with bladder cancer was analyzed by grouping the samples based on LINC01140 expression using log-rank test. Data are based on TCGA database. (C) The expression of LINC01140 in tissues of 12 cases of MIBC and 12 cases of NMIBC was determined using real-time PCR. P<0.01, paired student’s T test. (D) The correlation between LINC01140 and FGF9 expression in tissue samples was analyzed using Pearson’s correlation analysis. **P<0.01.
Next, LINC01140 expression was determined in tissues from 12 cases of MIBC and 12 cases of NMIBC tissue using real-time PCR; similar to FGF9, the expression of LINC01140 was remarkably upregulated in MIBC tissue samples compared with NMIBC tissue samples (Figure 3C). In tissue samples, LINC01140 and FGF9 expression was positively correlated (Figure 3D).
Effects of LINC01140 upon the aggressiveness of bladder carcinoma cells and the polarization of macrophage M2
To validate the specific effect of LINC01140 on the aggressiveness of bladder carcinoma cells and the development of MIBC, we transfected si-LINC01140 to generate LINC01140 knockdown in T24 cells, and performed real-time PCR to verify the transfection efficiency (Figure 4A). Similar to FGF9 knockdown, LINC01140 knockdown significantly inhibited T24 cell viability, migration and invasiveness (Figure 4B–4D). The protein levels of FGF9, ki-67, MMP-2, and MMP-9 were also obviously decreased by LINC01140 knockdown (Figure 4E).
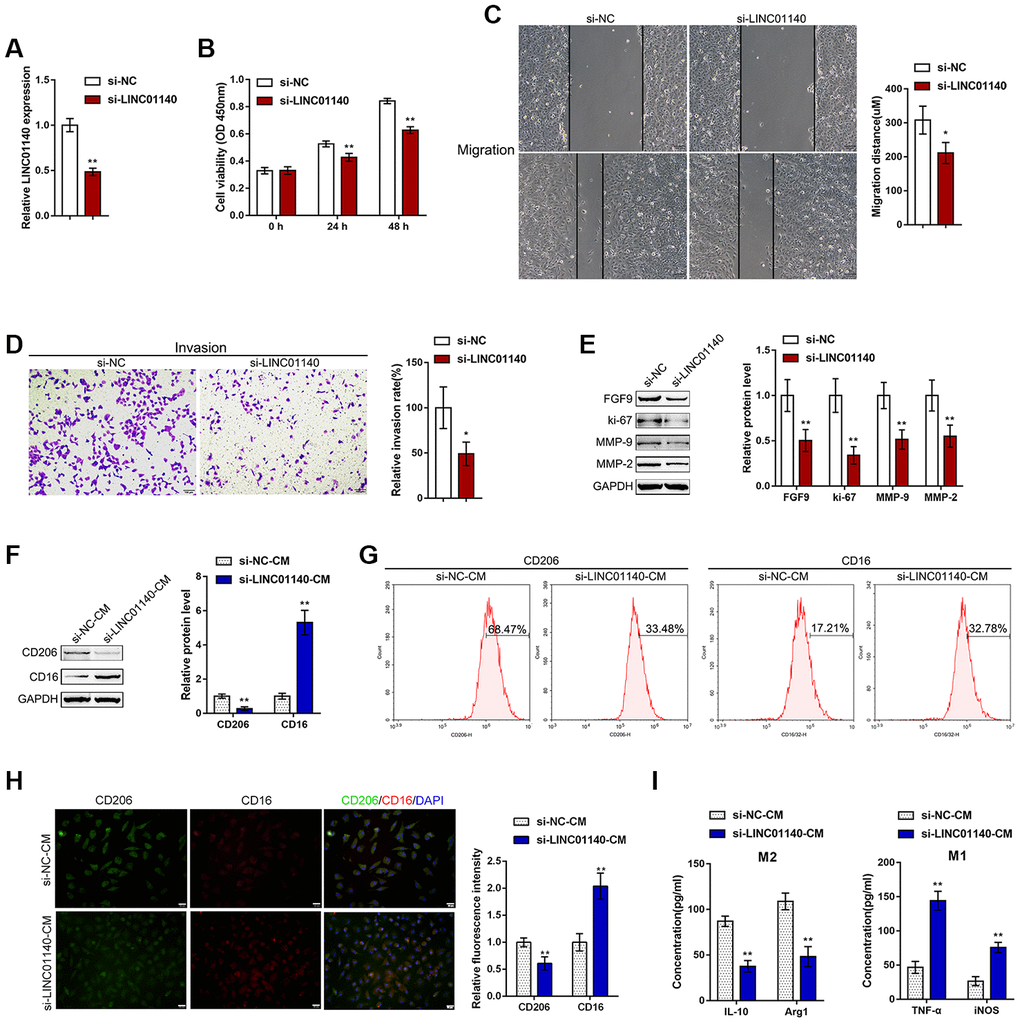
Figure 4. Effects of LINC01140 on bladder cancer cell aggressiveness and macrophage M2 polarization. (A) LINC01140 knockdown was generated in the T24 bladder cancer cell line by transfection with si-LINC01140. The transfection efficiency was validated by real-time PCR (P<0.01, student’s T test). Next, T24 cells were transfected with si-LINC01140 and examined for (B) cell viability by MTT assay, **P<0.01, one-way ANOVA test.; (C) migration capacity by wound healing assay, P<0.05, student’s T test; (D) invasive capacity by Transwell assay, P<0.05, student’s T test; and (E) protein levels of FGF9, ki-67, MMP-2, and MMP-9 by immunoblotting, P<0.01, student’s T test. T24 cells were transfected with si-LINC01140 or si-NC (negative control) and the culture medium (shown in the figures as conditioned medium, si-NC-CM and si-LINC01140-CM) was collected for macrophage incubation. Monocytes were treated with 50 ng/ml M-CSF to stimulate monocyte differentiation into M0 macrophages. M0 macrophages were divided into four groups: IL-4 (M2 polarization inducing) + si-NC-CM, IL-4 (M2 polarization inducing) + si-LINC01140-CM, LPS + IFNγ (M1 polarization inducing) + si-NC-CM, and LPS + IFNγ (M1 polarization inducing) + si-LINC01140-CM, and examined for (F) the protein levels of CD206 and CD16 by immunoblotting, P<0.01, student’s T test; (G) the percentage of CD206 and CD16-positive cells was determined by flow cytometry; (H) the inflorescence intensity of CD206 and CD16 were measured by IF staining, The inflorescence intensity is shown in the right panel. P<0.01, student’s T test. (I) The concentrations of IL-10, Arg1, iNOS, and TNF-α in the macrophage culture medium was determined by ELISA. **P<0.01, student’s T test.
Next, similarly, T24 cells were transfected with si-LINC01140 or si-NC (negative control) and the culture medium (shown in the figures as conditioned medium si-NC-CM and si-LINC01140-CM) was collected for macrophage incubation. M0 macrophages were divided into four groups: IL-4 (M2 polarization inducing) + si-NC-CM, IL-4 (M2 polarization inducing) + si-LINC01140-CM, LPS + IFNγ (M1 polarization inducing) + si-NC-CM, and LPS + IFNγ (M1 polarization inducing) + si-LINC01140-CM. M1/2 polarization markers were then examined. Under M2 polarization conditions, culture with si-LINC01140-CM significantly decreased the protein levels of the M2 marker CD206 while increasing the M1 marker CD16 in macrophages (Figure 4F). Moreover, the flow cytometry results and IF results further confirmed that si- LINC01140-CM decreased the percentage of CD206-positive cells and CD206 in fluorescence intensity while increased the percentage of CD16 positive rate and CD16 fluorescence intensity (Figure 4G and Figure 4H). Moreover, the concentrations of M2 markers IL-10 and Arg1 were significantly decreased, while the concentrations of the M1 markers iNOS and TNF-α were increased in si-LINC01140-CM-treated cells (Figure 4G). These data suggest that LINC01140 might also act as an oncogene in bladder cancer, possibly by affecting bladder cancer cell aggressiveness and macrophage M2 polarization.
miR-140-5p directly targets LINC01140 and 3'UTR of FGF9
Since lncRNAs can competitively target miRNAs via their MREs (miRNA response elements) to act as ceRNAs (competing endogenous RNAs), thus regulating the expression of downstream target RNAs [40], here, we hypothesized that miRNAs might be involved in the effect of LINC01140 and FGF9 on the aggressiveness of bladder carcinoma cells and macrophage M2 polarization. We used six online tools (mirDIP, TargetScan, starBase V3, microT-CDS, miRDB, and LncTar) to identify miRNAs that might simultaneously target both LINC01140 and the FGF9 3'UTR; we selected two miRNAs, miR-140-5p and miR-580-3p (Figure 5A). Next, we performed real-time PCR to examine miR-140-5p and miR-580-3p expression in both T24 cells and a normal human bladder epithelial cell line, SV-HUC-1; the expression of miR-140-5p was considerably downregulated in T24 cells while miR-580-3p expression showed no significant changes (Figure 5B). Thus, we selected miR-140-5p for further experiments.
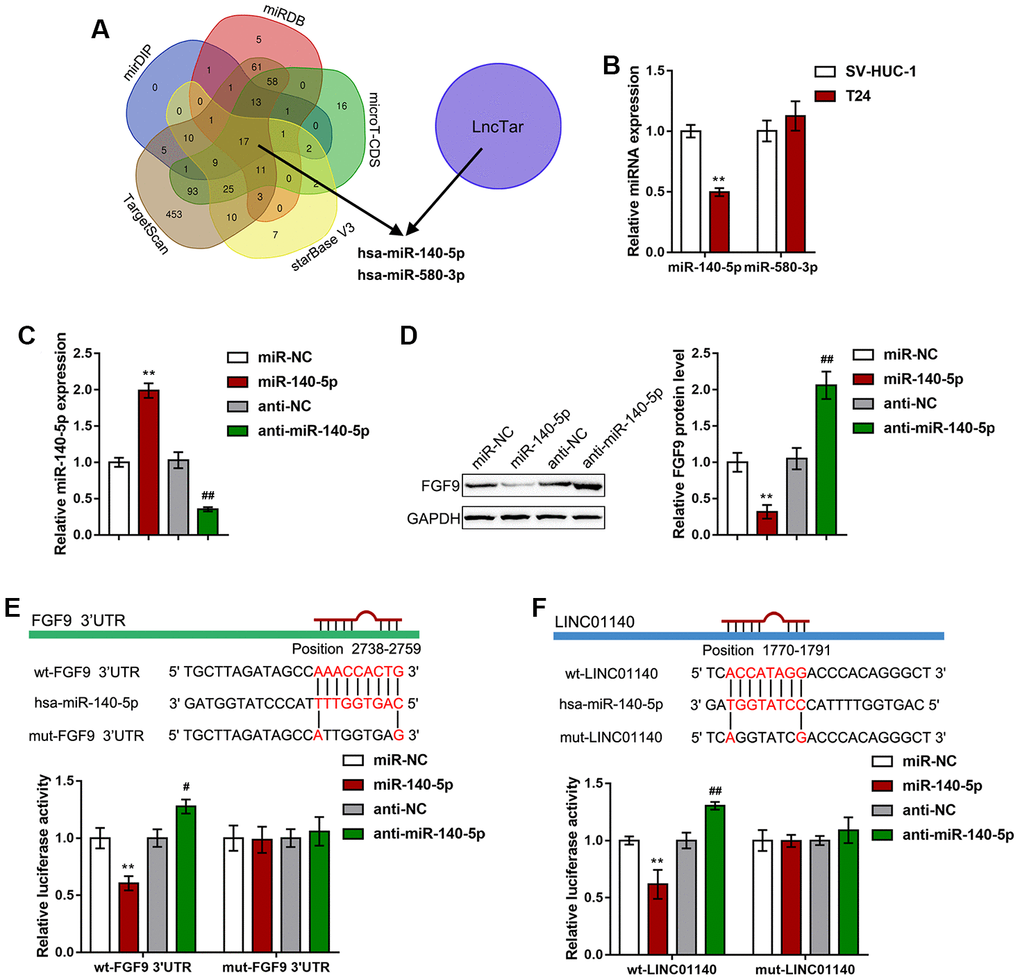
Figure 5. miR-140-5p directly targets LINC01140 and the FGF9 3'UTR. (A) miRNAs that might simultaneously target both LINC01140 and FGF9 3'UTR were predicted and selected by the online tools, mirDIP, TargetScan, starBase V3, microT-CDS, miRDB, and LncTar. Two miRNAs, miR-140-5p and miR-580-3p were selected. (B) The expression of miR-140-5p and miR-580-3p was determined in SV-HUC-1 and T24 cells by real-time PCR. P<0.01, student’s T test. (C) miR-140-5p was overexpressed or inhibited in T24 cells by the transfection of miR-140-5p or anti-miR-140-5p. The transfection efficiency was validated by real-time PCR. P<0.01, one way ANOVA test. (D) T24 cells were transfected with miR-140-5p or anti-miR-140-5p and examined for the protein levels of FGF9 by immunoblotting, P<0.01, one way ANOVA test. (E, F) Wild-type and mutant LINC01140 and FGF9 3'UTR luciferase reporter vectors were constructed as described in the Materials and methods section. These vectors were cotransfected with miR-140-5p or anti-miR-140-5p in 293T cells. The changes in luciferase activity were determined. P<0.01, one way ANOVA test. **P<0.01, #P<0.05, ##P<0.01.
To investigate the specific effect of miR-140-5p, we transfected miR-140-5p/ anti-miR-140-5p to overexpress or inhibit miR-140-5p in T24 cells, and performed real-time PCR to verify the transfection efficiency (Figure 5C). In T24 cells, miR-140-5p overexpression remarkably reduced FGF9 protein levels, while miR-140-5p inhibition increased FGF9 protein levels (Figure 5D). To further confirm the relevance of miR-140-5p to LINC01140 and FGF9, we measured the levels of miR-140-5p in response to LINC01140 and FGF9 knockdown. As shown in Supplementary Figure 2A, knockdown of LINC01140 increased the levels of miR-140-5p, while knockdown of FGF9 did not affect the miR-140-5p levels (Supplementary Figure 2B).
To validate the predicted binding of miR-140-5p and LINC01140 and FGF9 3'UTR, a luciferase reporter assay was performed. Based on the Materials and Methods section, we constructed two different types of LINC01140 and FGF9 3'UTR luciferase reporter vectors, wild-type and mutant. Second, we cotransfected these vectors with miR-140-5p/anti-miR-140-5p in 293T cells. Figure 5E, 5F shows that wild-type LINC01140 and FGF9 3'UTR vector luciferase activity was obviously inhibited by the overexpression of miR-140-5p but enhanced by the inhibition of miR-140-5p. Furthermore, mutating the putative miR-140-5p binding site eliminated the changes in luciferase activity. These data indicate that LINC01140 and FGF9 3'UTR are the direct downstream targets of miR-140-5p.
Dynamic effects of LINC01140 and miR-140-5p on the aggressiveness of bladder cancer cells and the polarization of M2 macrophages
First, we confirmed the binding of miR-140-5p and LINC01140 to the FGF9 3'UTR. Next, we continued to investigate the dynamic effects of LINC01140 and miR-140-5p on FGF9 protein levels and bladder cancer cells. We cotransfected T24 cells with si-LINC01140 and anti-miR-140-5p and then determined the related indexes. LINC01140 knockdown significantly suppressed, whereas the inhibition of miR-140-5p enhanced T24 cell viability (Figure 6A), migration capacity (Figure 6C), and invasive capacity (Figure 6D); the roles of LINC01140 knockdown showed to be significantly reversed via the inhibition of miR-140-5p. Similarly, LINC01140 knockdown significantly suppressed FGF9, ki-67, MMP-2, and MMP-9 protein levels, while the inhibition of miR-140-5p enhanced FGF9, ki-67, MMP-2, and MMP-9 protein levels; the effects of LINC01140 knockdown were significantly reversed by the inhibition of miR-140-5p (Figure 6B). Regarding macrophage M2 polarization, T24 cells were cotransfected with si-LINC01140 and anti-miR-140-5p and the culture medium (shown in the figures as conditioned medium (CM) si-NC + anti-NC, si-LINC01140 + anti-NC, si-NC + anti-miR-140-5p, and si-LINC01140 + anti-miR-140-5p) was collected for macrophage incubation. M0 macrophages were cultured in the above-described four kinds of CMs and polarized to M1 or M2, accordingly. Under M2 polarization conditions, culture in si-LINC01140 + anti-NC CM significantly decreased the expression of the M2 marker CD206 (Figure 6E) and the concentration of IL-10, and Arg1 in the culture media (Figure 6F). In contrast, culture in si-NC + anti-miR-140-5p CM increased M2 marker levels, including CD206 (Figure 6E), IL-10, and Arg1 (Figure 6F). Under M1 polarization conditions, culture in si-LINC01140 + anti-NC CM decreased the M1 markers TNF-α and iNOS (Figure 6F). Notably, under si-LINC01140 + anti-miR-140-5p CM, the effects of LINC01140 knockdown were significantly reversed by the inhibition of miR-140-5p (Figure 6E–6G), indicating that LINC01140 targets miR-140-5p to counteract miR-140-5p-mediated suppression of FGF9, therefore promoting bladder cancer cell aggressiveness and macrophage M2 polarization.
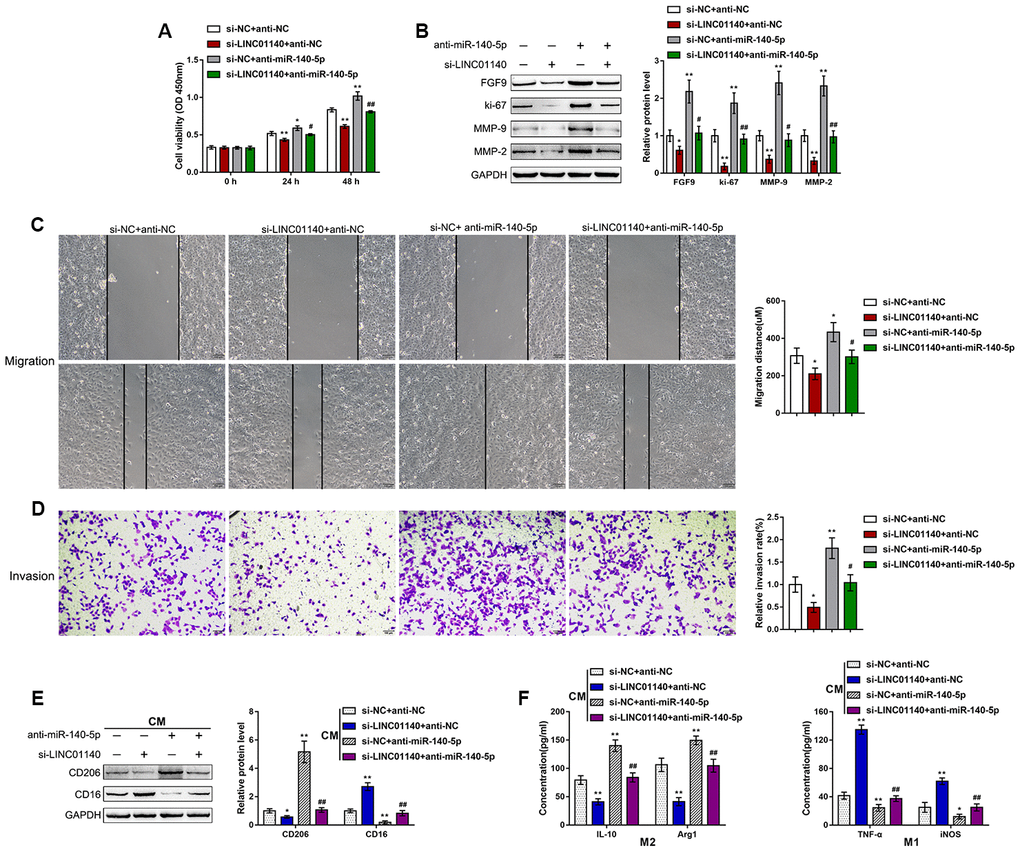
Figure 6. Dynamic effects of LINC01140 and miR-140-5p on bladder cancer cell aggressiveness and macrophage M2 polarization T24 cells were cotransfected with si-LINC01140 and anti-miR-140-5p and examined for (A) the cell viability by MTT assay; (B) protein levels of FGF9, ki-67, MMP-2, and MMP-9 by immunoblotting; (C) migration capacity by wound healing assay; and (D) invasive capacity by Transwell assay. (E, F) T24 cells were cotransfected with si-LINC01140 and anti-miR-140-5p and the culture medium (shown in the figures as conditioned medium (CM) si-NC + anti-NC, si-LINC01140 + anti-NC, si-NC + anti-miR-140-5p, and si-LINC01140 + anti-miR-140-5p) was collected for macrophage incubation. M0 macrophages were cultured in the above-described four kinds of CMs and polarized to M1 or M2, respectively, and examined for (E) the protein levels of CD206 and CD16 by immunoblotting. (F) The concentrations of IL-10, Arg1, iNOS, and TNF-α in the macrophage culture medium was determined by ELISA. *P<0.05, **P<0.01, compared to control group; #P<0.05, ##P<0.01, compared to si-NC + anti-miR-140-5p group. One way ANOVA test was used for statistical analysis.
Discussion
FGF9 (fibroblast growth factor 9) belongs to the human FGF family and plays a critical role in embryo development, tissue repair, tumorigenesis and many other biological functions [33–35]. FGF9 is identified as an important epithelial-to-mesenchymal transition signal required for embryo development [36], furthermore, it has been reported to be expressed in various tumors, such as colon cancer, gastric carcinoma and lung carcinoma [37–39]. FGF9 has carcinogenic activities, which support a function for its increase in the pathogenesis of several cancers. Transfecting human fibroblast growth factor 9 (FGF-9) cDNA into mouse BALB/c 3T3 clone A31 cells could lead to morphological transformation of the cells, formation of foci, soft agar growth and tumor formation within nude mice [40]. In bladder cancer, online data analysis indicated that the expression of FGF9 was markedly increased in MIBC tissues compared within NMIBC tissues, suggesting that FGF9 upregulation might be related to the aggressiveness of bladder carcinoma cells. As previously mentioned, high M2-like polarized macrophage infiltration correlated with worse clinical outcomes in bladder carcinoma patients [19]. M2 macrophages are the main type of bladder cancer-related macrophages and can accelerate bladder cancer progression [18, 19]. Notably, herein, macrophage M2 polarization was more frequently observed in MIBC tissues. Reportedly, FGF9 can enhance M2 macrophage polarization in the infarcted diabetic heart [17]; thus, it is reasonable to speculate that FGF9 might modulate macrophage M2 polarization, therefore affecting bladder cancer cell aggressiveness. As expected, FGF9 knockdown in T24 bladder carcinoma cells remarkably suppressed the viability, migratory capacity and invasive capacity of cells. More importantly, after incubation with conditioned medium derived from FGF9 knockdown T24 cells (si-FGF9-CM), the M2 polarization of macrophages was blocked, suggesting that abnormal FGF9 upregulation in bladder cancer might promote macrophage M2 polarization to accelerate cancer development.
LncRNAs are essential for tumorigenesis [41]. By modulating gene expression via transcription, posttranscriptional processing, chromatin modification, protein function modulation and many other mechanisms, lncRNAs contribute to various tumor initiation processes [42, 43]. Bladder cancer also shows changes in the expression levels of multiple lncRNAs. Various in vitro and in vivo investigations have evaluated the effects of knocking down RNAs in cancer cell phenotypes and in vivo tumor growth [44]. Interestingly, lncRNAs, including MM2P [31], MALAT1 [30], GNAS-AS1 [45], and SNHG12 [46], have been reported to modulate macrophage M1/2 polarization [47, 48]. According to online data, the expression of lncRNA LINC01140 was obviously increased in MIBC and had a positive correlation with the expression of FGF9, suggesting an underlying effect on bladder carcinoma. Song et al. [49] reported that a higher level of LINC01140 was linked to a decreased survival of gastric carcinoma patients. Moreover, it has been revealed by gene set enrichment analysis revealed that high risk scores had a positive correlation with some molecular pathways of cancer metastasis. In the present study, LINC01140 knockdown in T24 cells significantly inhibited the viability, migratory capacity, and invasive capacity of cells. Similarly, culture with si-LINC01140-CM inhibited macrophage M2 polarization, indicating that LINC01140 might cooperate with FGF9 to modulate macrophage M2 polarization in bladder cancer, therefore affecting cancer cell aggressiveness.
The delineation of the mechanism by which lncRNAs regulate gene expression remains a major challenge. As we have mentioned, lncRNAs can regulate gene expression through transcription, posttranscriptional processing, chromatin modification, protein function modulation and many other mechanisms. However, there is increasing evidence that lncRNAs can competitively target miRNAs via their MREs (miRNA response elements) to act as ceRNAs (competing endogenous RNAs), thus regulating the expression of miRNA downstream target RNAs [32]. Since LINC01140 and FGF9 expression was positively correlated in bladder cancer tissues, the present study further searched for miRNAs that might simultaneously target both LINC01140 and FGF9. Of the two candidate miRNAs, miR-140-5p and miR-580-3p, the expression of miR-140-5p was found to be dramatically downregulated in T24 cells compared with normal cells. Moreover, experimental results confirmed the online tool predictions that LINC01140 targets miR-140-5p, while miR-140-5p targets FGF9. Thus, LINC01140 might relieve miR-140-5p-induced inhibition of FGF9 by acting as a ceRNA, therefore affecting macrophage M2 polarization in bladder cancer.
miR-140-5p is known for its tumor suppressive effect on a variety of cancers, such as hepatocellular carcinoma [50], ovarian carcinoma [51], colorectal cancer [52, 53], and hypopharyngeal squamous cell carcinoma [54]. Interestingly, it has been shown that miR-140-5p targets FGF9 to inhibit hepatocellular carcinoma growth and metastasis [50]. Knockdown FGF9 via siRNA (small interfering RNA) resulted in a similar phenotype as ectopic miR-140-5p expression, whereas FGF9 overexpression reversed the effects of miR-140-5p in hepatocellular carcinoma growth and metastasis [50]. Accordingly, miR-140-5p inhibition in T24 cells significantly promoted the viability, migratory capacity and invasive capacity of cancer cells. In contrast to si-LINC01140-CM or si-FGF9-CM, anti-miR-140-5p-CM significantly promoted macrophage M2 polarization. Overall, the inhibition of miR-140-5p reversed the effects of LINC01140 knockdown on FGF9 expression, bladder cancer phenotype, and macrophage M2 polarization, indicating that miR-140-5p mediates the crosstalk between LINC01140 and FGF9, thus modulating macrophage M2 polarization to affect bladder cancer cell aggressiveness.
In conclusion, LINC01140, miR-140-5p, and FGF9 form a lncRNA-miRNA-mRNA axis that modulates the bladder cancer phenotype, affects macrophage M2 polarization through the tumor microenvironment, and in turn affects bladder cancer cell aggressiveness (Figure 7). However, the application of this axis needs further in vivo and clinical investigation.
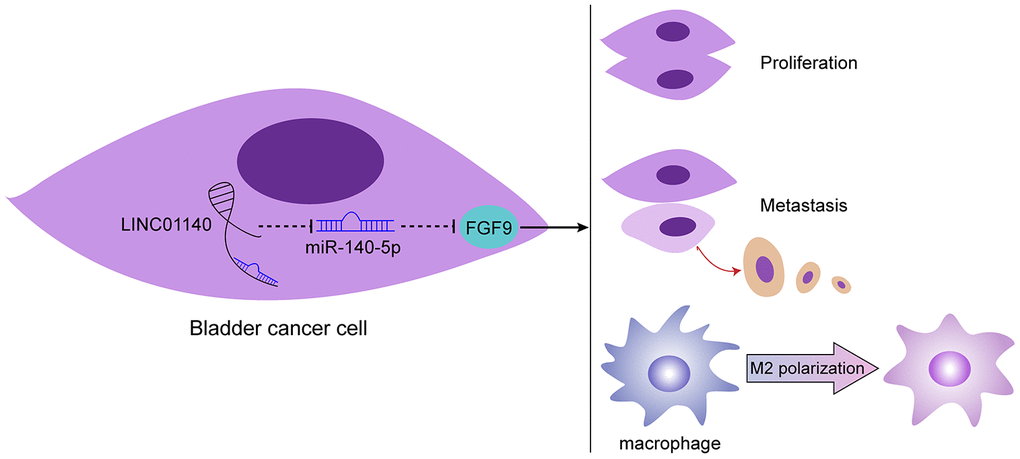
Figure 7. Schematic diagram of the proposed mechanism. LINC01140/miR-140-5p/FGF9 axis modulates bladder cancer phenotype and promotes macrophage M2 polarization through tumor microenvironment.
Materials and Methods
Clinical sampling
Muscular invasive bladder cancer (MIBC) tissue samples from 12 cases and non-muscular invasive bladder cancer (NMIBC) tissue samples from 12 cases were obtained from patients clinically and histologically diagnosed at The Second Xiangya Hospital with the approval of the institutional Ethics Committee. Written informed consent was obtained from each patient enrolled. The clinic character was shown in Supplementary Table 1.
Cell lines and cell transfection
Human bladder epithelial SV40 immortalized cell line, SV-HUC-1 (ATCC® CRL-9520), was obtained from ATCC (Manassas, VA, USA) and cultured in F-12K Medium (Catalog No. 30-2004, ATCC) supplemented with 10% FBS. A bladder cancer cell line, T24 (ATCC® HTB-4), was obtained from ATCC and cultured in McCoy's 5a Medium Modified (Catalog No. 30-2007, ATCC) supplemented with 10% FBS. All cells were cultured at 37° C in 5% CO2.
The expression of miR-140-5p was modulated by transfection of miR-140-5p or anti-miR-140-5p (GenePharma, Shanghai, China). FGF9 or LINC01140 was knocked down by transfection of si-FGF9 or si-LINC01140 (GenePharma). All transfections were performed using the transfection agent Lipofectamine 3000 (Invitrogen). The relative sequences are shown in Supplementary Table 2.
Bioinformatic analysis
To identify genes related to MIBC, we downloaded a microarray expression profile dataset, GSE77952, from Gene Expression Omnibus (GEO). This dataset reported the differentially expressed genes, including protein-coding RNAs and noncoding RNAs, between 14 cases of MIBC and 16 cases of NMIBC tissues. In this dataset, a total of 45 cytokines were deregulated in MIBC; after literature review, FGF9 was selected for further experiments.
Survival analysis
To analyze the correlation of FGF9 or LINC01140 expression with the overall survival in patients with bladder cancer, we used the American National Cancer Institute's genomic data sharing port database (GDC, Genomic Data Commons; https://portal.gdc.cancer.gov/). We selected TCGA-BLCA from the Project menu on the repository page, downloaded the transcriptome data (transcriptome profiling) from the Files menu, and then selected RNA-seq (HTseq-Counts) Public data; the total number of samples was 434. The R language tool was used to read the sequencing data of each sample and integrate it into an expression matrix. The expression matrix was then homogenized with the DEseq2 and Edge R packages for a standardized expression matrix. Normalized gene expression data for FGF9 (ENSG00000102678) and LINC01140 (ENSG00000267272) were extracted from this matrix. The survival curve was obtained by the survival and survminer R packages. The raw survival data were analyzed using the R language package (RTCGA.clinical). The parameters used were patient survival (patient.vital_status), the time from follow-up to death (patient.ups. Follow_up.days_to_death), and the time the patient had survived at the last follow-up (patient.ups. Follow_up.days_to_last_followup). All the above parameters are expressed in days. When dealing with survival data, cases with a survival time of less than 30 days or missing values were removed because a survival time of less than 30 days might be represented death due to rapidly deteriorating health post surgery, and may not be directly related to tumor gene expression. Finally, 286 patients were analyzed. When grouping the cases by the median value of gene expression, the minimum value of the ratio of high and low expression groups was 30/70, that is, the two groups of samples had to distributed between 30% and 70% (minprop = 0.3) to ensure that there was no large deviation between the two sets of samples. Univariate Cox regression analysis was used to analyze the overall survival.
PCR-based analysis
Total RNA was extracted from target tissues or cells using TRIzol reagent (Cat:15596018, Invitrogen). After that, the expression of lncRNA, miRNA, and mRNA was determined by real-time PCR using a SYBR Green qPCR assay (Cat.DRR820A, Takara, Dalian, China) following the methods described before [55]. The expression of RNU6B or GAPDH was used as an endogenous control for miRNA or mRNA expression calculations. The data processing and relative fold-change calculation were generated using the 2-ΔΔCT method. The primer sequences are listed in Supplementary Table 2.
Immunoblotting
To monitor the changes in the protein levels of FGF9, ki-67, MMP-2, and MMP-9, we performed immunoblotting following the methods described before [55] with antibodies against CD206, CD16, FGF9, ki-67, MMP-2, and MMP-9 (ab64693, ab46679, ab71395, ab15580, and ab38898, Abcam, Cambridge, UK) followed by another incubation with the appropriate HRP-conjugated secondary antibodies. GAPDH (ab16891, Abcam) was used as an endogenous control. Signals were visualized using enhanced chemiluminescent (ECL) substrates (WBKlS0100, Millipore, MA, USA) and were normalized to the GAPDH signal.
Hematoxylin and eosin (H&E) staining
MIBC and NMIBC tissues were fixed in 4% paraformaldehyde for 24 h. Then, the tissue blocks were dehydrated, embedded in paraffin, and cut into 4-μm-thick slices. After dewaxing, the slices were stained with H&E using standard procedures [56, 57].
Immunofluorescence (IF) staining for bladder cancer tissues
For the detection of CD163 in bladder cancer tissues, tissue samples were fixed in 4% formaldehyde and embedded in paraffin. Tissues were blocked with 100 mM ammonium chloride buffer for 10 min to minimize autofluorescence. Nonspecific binding sites were blocked with PBS containing 10% horse serum followed by an incubation with the primary antibody specific to CD163 (ab87099, Abcam) overnight at 4° C, diluted in blocking solution. Cy3-conjugated goat anti-rabbit secondary antibody (A0516, Beyotime, China) was incubated at room temperature for 1 h. DAPI (C1002, Beyotime, China) was used to stain the nucleus before capturing images. The images were acquired using a fluorescence microscope (Nikon, Japan). The red fluorescence indicates CD163 expression, and the blue fluorescence indicates the nucleus.
Monocyte isolation and differentiation into macrophages
Human peripheral blood mononuclear cells (PBMCs) were obtained from the venous blood of healthy volunteers and separated through Ficoll density gradient centrifugation. Next, monocytes were isolated from PBMCs using anti-CD14 magnetic beads (Life Technologies, USA) following the manufacturer's instructions. The nonadherent cells were removed, and purified monocytes were cultured in RPMI 1640 medium supplemented with 10% FBS for one week. Then, 50 ng/ml macrophage-colony stimulating factor (M-CSF; R&D Systems, USA) was used for seven days to obtain M0 macrophages. To stimulate M0 macrophages to differentiate into M1 or M2 macrophages, the study stimulated M0 macrophages with 100 ng/ml LPS (Sigma-Aldrich) + 20 ng/ml IFN-γ (eBioscience) for M1 polarization induction or 20 ng/ml IL-4 (eBioscience) for M2 polarization for 48 h following the methods described previously [58–60].
For macrophage surface markers determination by flow cytometry, cells were stained with an anti-CD11b (ab24874, Abcam), anti-CD206 (ab223960, Abcam) or anti-CD16 (ab234209, Abcam) fluorophore-conjugated antibody. Samples were then quantified using flow cytometry analysis of macrophage cell surface markers in a FACSCalibur flow cytometer (BD Biosciences). The isotype controls were shown in Supplementary Figure 1. For macrophage surface makers determination by IF, cells were seeded onto coverslips overnight, fixed with 4% paraformaldehyde PBS and incubated with anti-CD11b (ab8878, Abcam), anti-CD206 (ab64693, Abcam) or CD16 (ab46679) at 4° C overnight. FITC-conjugated or TRITC-conjugated secondary antibody (Beyotime, China) was incubated at room temperature for 1 h. The nuclei were stained with DAPI (KeyGen Biotech). Images were taken with a fluorescence microscope.
Cell viability evaluated by MTT assay
By following the methods described previously [61], cell viability was detected. After transfection or treatment, MTT (20 μl at a density of 5 mg/ml; Sigma-Aldrich) was added, and another 4-h incubation was conducted. At the end of the incubation, DMSO (200 μl) was added to dissolve the formazan. Next, OD values were measured at 490 nm and the relative cell viability was calculated by defining the nontreated cell viability (control) as 100%.
Cell migratory capacity evaluated by wound healing assay
Cells were seeded in 6-well plates at 5 × 10⁵ cells/ml, until the cells formed a monolayer, and then the cell wound healing assay was performed. The scratch area was measured under a microscope (Olympus, Japan) at 0 h and 48 h. The relative distance of cell migration to the scratch area was also measured under the microscope and analyzed by ImageJ software (NIH, USA).
Cell invasive capacity evaluated by Transwell assay
Cells (5 × 10⁵) were plated on the top side of polycarbonate Transwell filters coated with Matrigel. For Transwell invasion assays, cells were suspended in medium without serum and medium with serum was added to the bottom chamber. The cells were incubated at 37° C for 48 h. The noninvasive cells in the top chambers were removed with cotton swabs. The invasive cells on the lower membrane surface were fixed in 100% methanol for 10 min, air-dried, stained with crystal violet solution (C0121, Beyotime), and then counted under a microscope.
ELISA
Culture supernatants were harvested and centrifuged to remove cellular debris, and aliquots were stored at –80° C until assayed. The concentrations of IL-10, Arg1, iNOS, and TNF-α were determined using corresponding human ELISA kits (IL-10: D1000B, R&D Systems; Arg1: P05089, Cusabio, Houston, TX, USA; iNOS: P35228, Cusabio; TNF-α: DTA00D, R&D Systems) following the methods described previously [62].
Luciferase reporter assay
To validate the binding between miR-140-5p and LINC01140 or the 3'UTR of FGF9, the wild-type or mutated LINC01140 or the 3'UTR of FGF9 was cloned downstream of the Renilla gene in the psiCHECK2 vector (Promega, Madison, WI, USA), and the resulting constructs were named wt-LINC01140, wt-FGF9 3'UTR, mut-LINC01140 or mut-FGF9 3'UTR. Next, 293T cells were co-transfected with the two types of luciferase reporter vectors and miR-140-5p mimics/miR-140-5p inhibitor and examined for luciferase activity using the Dual-Luciferase Reporter Assay System (Promega).
Data processing and statistical analysis
The data were analyzed with GraphPad software. The measurement data are expressed as the mean ± standard deviation (SD). Intergroup and intra-group data comparisons were performed with the ANOVA and Student’s t-tests. P<0.05 indicates a statistically significant difference.
Author Contributions
RX and SW designed experiments, SW, JZ, HH and XZ performed experiments, analyzed data, and prepared the manuscript; QZ, SW and YW performed bioinformatics and statistical analyses; RX, SW and XZ revised the manuscript. All authors discussed the results and interpretation of the data throughout all stages of the project.
Conflicts of Interest
These authors declare no conflicts of interest.
Funding
This study was supported by the grant from Science and Technology Agency of Hunan Province (no. 2020JJ4820).
References
- 1. Sanli O, Dobruch J, Knowles MA, Burger M, Alemozaffar M, Nielsen ME, Lotan Y. Bladder cancer. Nat Rev Dis Primers. 2017; 3:17022. https://doi.org/10.1038/nrdp.2017.22 [PubMed]
- 2. Babjuk M, Böhle A, Burger M, Capoun O, Cohen D, Compérat EM, Hernández V, Kaasinen E, Palou J, Rouprêt M, van Rhijn BW, Shariat SF, Soukup V, et al. EAU guidelines on non-muscle-invasive urothelial carcinoma of the bladder: update 2016. Eur Urol. 2017; 71:447–61. https://doi.org/10.1016/j.eururo.2016.05.041 [PubMed]
- 3. Robertson AG, Kim J, Al-Ahmadie H, Bellmunt J, Guo G, Cherniack AD, Hinoue T, Laird PW, Hoadley KA, Akbani R, Castro MA, Gibb EA, Kanchi RS, et al, and TCGA Research Network. Comprehensive molecular characterization of muscle-invasive bladder cancer. Cell. 2017; 171:540–56.e25. https://doi.org/10.1016/j.cell.2017.09.007 [PubMed]
- 4. Sjödahl G, Lauss M, Lövgren K, Chebil G, Gudjonsson S, Veerla S, Patschan O, Aine M, Fernö M, Ringnér M, Månsson W, Liedberg F, Lindgren D, Höglund M. A molecular taxonomy for urothelial carcinoma. Clin Cancer Res. 2012; 18:3377–86. https://doi.org/10.1158/1078-0432.CCR-12-0077-T [PubMed]
- 5. Choi W, Porten S, Kim S, Willis D, Plimack ER, Hoffman-Censits J, Roth B, Cheng T, Tran M, Lee IL, Melquist J, Bondaruk J, Majewski T, et al. Identification of distinct basal and luminal subtypes of muscle-invasive bladder cancer with different sensitivities to frontline chemotherapy. Cancer Cell. 2014; 25:152–65. https://doi.org/10.1016/j.ccr.2014.01.009 [PubMed]
- 6. Kijima T, Tanaka H, Koga F, Masuda H, Yoshida S, Yokoyama M, Ishioka J, Matsuoka Y, Saito K, Kihara K, Fujii Y. Selective tetramodal bladder-preservation therapy, incorporating induction chemoradiotherapy and consolidative partial cystectomy with pelvic lymph node dissection for muscle-invasive bladder cancer: oncological and functional outcomes of 107 patients. BJU Int. 2019; 124:242–50. https://doi.org/10.1111/bju.14736 [PubMed]
- 7. Wang M, Zhao J, Zhang L, Wei F, Lian Y, Wu Y, Gong Z, Zhang S, Zhou J, Cao K, Li X, Xiong W, Li G, et al. Role of tumor microenvironment in tumorigenesis. J Cancer. 2017; 8:761–73. https://doi.org/10.7150/jca.17648 [PubMed]
- 8. Kitamura T, Qian BZ, Pollard JW. Immune cell promotion of metastasis. Nat Rev Immunol. 2015; 15:73–86. https://doi.org/10.1038/nri3789 [PubMed]
- 9. Şenbabaoğlu Y, Gejman RS, Winer AG, Liu M, Van Allen EM, de Velasco G, Miao D, Ostrovnaya I, Drill E, Luna A, Weinhold N, Lee W, Manley BJ, et al. Tumor immune microenvironment characterization in clear cell renal cell carcinoma identifies prognostic and immunotherapeutically relevant messenger RNA signatures. Genome Biol. 2016; 17:231. https://doi.org/10.1186/s13059-016-1092-z [PubMed]
- 10. Wang N, Liang H, Zen K. Molecular mechanisms that influence the macrophage m1-m2 polarization balance. Front Immunol. 2014; 5:614. https://doi.org/10.3389/fimmu.2014.00614 [PubMed]
- 11. Qian BZ, Pollard JW. Macrophage diversity enhances tumor progression and metastasis. Cell. 2010; 141:39–51. https://doi.org/10.1016/j.cell.2010.03.014 [PubMed]
- 12. Ruffell B, Coussens LM. Macrophages and therapeutic resistance in cancer. Cancer Cell. 2015; 27:462–72. https://doi.org/10.1016/j.ccell.2015.02.015 [PubMed]
- 13. Takayama H, Nishimura K, Tsujimura A, Nakai Y, Nakayama M, Aozasa K, Okuyama A, Nonomura N. Increased infiltration of tumor associated macrophages is associated with poor prognosis of bladder carcinoma in situ after intravesical bacillus calmette-guerin instillation. J Urol. 2009; 181:1894–900. https://doi.org/10.1016/j.juro.2008.11.090 [PubMed]
- 14. Biton A, Bernard-Pierrot I, Lou Y, Krucker C, Chapeaublanc E, Rubio-Pérez C, López-Bigas N, Kamoun A, Neuzillet Y, Gestraud P, Grieco L, Rebouissou S, de Reyniès A, et al. Independent component analysis uncovers the landscape of the bladder tumor transcriptome and reveals insights into luminal and basal subtypes. Cell Rep. 2014; 9:1235–45. https://doi.org/10.1016/j.celrep.2014.10.035 [PubMed]
- 15. Rebouissou S, Bernard-Pierrot I, de Reyniès A, Lepage ML, Krucker C, Chapeaublanc E, Hérault A, Kamoun A, Caillault A, Letouzé E, Elarouci N, Neuzillet Y, Denoux Y, et al. EGFR as a potential therapeutic target for a subset of muscle-invasive bladder cancers presenting a basal-like phenotype. Sci Transl Med. 2014; 6:244ra91. https://doi.org/10.1126/scitranslmed.3008970 [PubMed]
- 16. Beisser D, Klau GW, Dandekar T, Müller T, Dittrich MT. BioNet: an r-package for the functional analysis of biological networks. Bioinformatics. 2010; 26:1129–30. https://doi.org/10.1093/bioinformatics/btq089 [PubMed]
- 17. Singla DK, Singla RD, Abdelli LS, Glass C. Fibroblast growth factor-9 enhances M2 macrophage differentiation and attenuates adverse cardiac remodeling in the infarcted diabetic heart. PLoS One. 2015; 10:e0120739. https://doi.org/10.1371/journal.pone.0120739 [PubMed]
- 18. Aljabery F, Olsson H, Gimm O, Jahnson S, Shabo I. M2-macrophage infiltration and macrophage traits of tumor cells in urinary bladder cancer. Urol Oncol. 2018; 36:159.e19–26. https://doi.org/10.1016/j.urolonc.2017.11.020 [PubMed]
- 19. Martínez VG, Rubio C, Martínez-Fernández M, Segovia C, López-Calderón F, Garín MI, Teijeira A, Munera-Maravilla E, Varas A, Sacedón R, Guerrero F, Villacampa F, de la Rosa F, et al. BMP4 induces M2 macrophage polarization and favors tumor progression in bladder cancer. Clin Cancer Res. 2017; 23:7388–99. https://doi.org/10.1158/1078-0432.CCR-17-1004 [PubMed]
- 20. Hegab AE, Ozaki M, Kagawa S, Hamamoto J, Yasuda H, Naoki K, Soejima K, Yin Y, Kinoshita T, Yaguchi T, Kawakami Y, Ornitz DM, Betsuyaku T. Tumor associated macrophages support the growth of FGF9-induced lung adenocarcinoma by multiple mechanisms. Lung Cancer. 2018; 119:25–35. https://doi.org/10.1016/j.lungcan.2018.02.015 [PubMed]
- 21. Kaikkonen MU, Adelman K. Emerging roles of non-coding RNA transcription. Trends Biochem Sci. 2018; 43:654–67. https://doi.org/10.1016/j.tibs.2018.06.002 [PubMed]
- 22. Djebali S, Davis CA, Merkel A, Dobin A, Lassmann T, Mortazavi A, Tanzer A, Lagarde J, Lin W, Schlesinger F, Xue C, Marinov GK, Khatun J, et al. Landscape of transcription in human cells. Nature. 2012; 489:101–08. https://doi.org/10.1038/nature11233 [PubMed]
- 23. Wang KC, Chang HY. Molecular mechanisms of long noncoding RNAs. Mol Cell. 2011; 43:904–14. https://doi.org/10.1016/j.molcel.2011.08.018 [PubMed]
- 24. Mou K, Liu B, Ding M, Mu X, Han D, Zhou Y, Wang LJ. lncRNA-ATB functions as a competing endogenous RNA to promote YAP1 by sponging miR-590-5p in Malignant melanoma. Int J Oncol. 2018; 53:1094–104. https://doi.org/10.3892/ijo.2018.4454 [PubMed]
- 25. Li X, Zhao X, Yang B, Li Y, Liu T, Pang L, Fan Z, Ma W, Liu Z, Li Z. Long non-coding RNA HOXD-AS1 promotes tumor progression and predicts poor prognosis in colorectal cancer. Int J Oncol. 2018; 53:21–32. https://doi.org/10.3892/ijo.2018.4400 [PubMed]
- 26. Sun D, Yu Z, Fang X, Liu M, Pu Y, Shao Q, Wang D, Zhao X, Huang A, Xiang Z, Zhao C, Franklin RJ, Cao L, He C. LncRNA GAS5 inhibits microglial M2 polarization and exacerbates demyelination. EMBO Rep. 2017; 18:1801–16. https://doi.org/10.15252/embr.201643668 [PubMed]
- 27. Gao X, Ge J, Li W, Zhou W, Xu L. LncRNA KCNQ1OT1 ameliorates particle-induced osteolysis through inducing macrophage polarization by inhibiting miR-21a-5p. Biol Chem. 2018; 399:375–86. https://doi.org/10.1515/hsz-2017-0215 [PubMed]
- 28. Zhou YX, Zhao W, Mao LW, Wang YL, Xia LQ, Cao M, Shen J, Chen J. Long non-coding RNA NIFK-AS1 inhibits M2 polarization of macrophages in endometrial cancer through targeting miR-146a. Int J Biochem Cell Biol. 2018; 104:25–33. https://doi.org/10.1016/j.biocel.2018.08.017 [PubMed]
- 29. Zeng XY, Xie H, Yuan J, Jiang XY, Yong JH, Zeng D, Dou YY, Xiao SS. M2-like tumor-associated macrophages-secreted EGF promotes epithelial ovarian cancer metastasis via activating EGFR-ERK signaling and suppressing lncRNA LIMT expression. Cancer Biol Ther. 2019; 20:956–66. https://doi.org/10.1080/15384047.2018.1564567 [PubMed]
- 30. Cui H, Banerjee S, Guo S, Xie N, Ge J, Jiang D, Zörnig M, Thannickal VJ, Liu G. Long noncoding RNA Malat1 regulates differential activation of macrophages and response to lung injury. JCI Insight. 2019; 4:e124522. https://doi.org/10.1172/jci.insight.124522 [PubMed]
- 31. Cao J, Dong R, Jiang L, Gong Y, Yuan M, You J, Meng W, Chen Z, Zhang N, Weng Q, Zhu H, He Q, Ying M, Yang B. LncRNA-MM2P identified as a modulator of macrophage M2 polarization. Cancer Immunol Res. 2019; 7:292–305. https://doi.org/10.1158/2326-6066.CIR-18-0145 [PubMed]
- 32. Salmena L, Poliseno L, Tay Y, Kats L, Pandolfi PP. A ceRNA hypothesis: the rosetta stone of a hidden RNA language? Cell. 2011; 146:353–58. https://doi.org/10.1016/j.cell.2011.07.014 [PubMed]
- 33. Govindan R, Ding L, Griffith M, Subramanian J, Dees ND, Kanchi KL, Maher CA, Fulton R, Fulton L, Wallis J, Chen K, Walker J, McDonald S, et al. Genomic landscape of non-small cell lung cancer in smokers and never-smokers. Cell. 2012; 150:1121–34. https://doi.org/10.1016/j.cell.2012.08.024 [PubMed]
- 34. Corn PG, Wang F, McKeehan WL, Navone N. Targeting fibroblast growth factor pathways in prostate cancer. Clin Cancer Res. 2013; 19:5856–66. https://doi.org/10.1158/1078-0432.CCR-13-1550 [PubMed]
- 35. Herbst RS, Heymach JV, Lippman SM. Lung cancer. N Engl J Med. 2008; 359:1367–80. https://doi.org/10.1056/NEJMra0802714 [PubMed]
- 36. Jin C, Wang F, Wu X, Yu C, Luo Y, McKeehan WL. Directionally specific paracrine communication mediated by epithelial FGF9 to stromal FGFR3 in two-compartment premalignant prostate tumors. Cancer Res. 2004; 64:4555–62. https://doi.org/10.1158/0008-5472.CAN-03-3752 [PubMed]
- 37. Chen TM, Shih YH, Tseng JT, Lai MC, Wu CH, Li YH, Tsai SJ, Sun HS. Overexpression of FGF9 in colon cancer cells is mediated by hypoxia-induced translational activation. Nucleic Acids Res. 2014; 42:2932–44. https://doi.org/10.1093/nar/gkt1286 [PubMed]
- 38. Sun C, Fukui H, Hara K, Zhang X, Kitayama Y, Eda H, Tomita T, Oshima T, Kikuchi S, Watari J, Sasako M, Miwa H. FGF9 from cancer-associated fibroblasts is a possible mediator of invasion and anti-apoptosis of gastric cancer cells. BMC Cancer. 2015; 15:333. https://doi.org/10.1186/s12885-015-1353-3 [PubMed]
- 39. Ohgino K, Soejima K, Yasuda H, Hayashi Y, Hamamoto J, Naoki K, Arai D, Ishioka K, Sato T, Terai H, Ikemura S, Yoda S, Tani T, et al. Expression of fibroblast growth factor 9 is associated with poor prognosis in patients with resected non-small cell lung cancer. Lung Cancer. 2014; 83:90–96. https://doi.org/10.1016/j.lungcan.2013.10.016 [PubMed]
- 40. Matsumoto-Yoshitomi S, Habashita J, Nomura C, Kuroshima K, Kurokawa T. Autocrine transformation by fibroblast growth factor 9 (FGF-9) and its possible participation in human oncogenesis. Int J Cancer. 1997; 71:442–50. https://doi.org/10.1002/(sici)1097-0215(19970502)71:3<442::aid-ijc23>3.0.co;2-g [PubMed]
- 41. Dai X, Kaushik AC, Zhang J. The emerging role of major regulatory RNAs in cancer control. Front Oncol. 2019; 9:920. https://doi.org/10.3389/fonc.2019.00920 [PubMed]
- 42. He RZ, Luo DX, Mo YY. Emerging roles of lncRNAs in the post-transcriptional regulation in cancer. Genes Dis. 2019; 6:6–15. https://doi.org/10.1016/j.gendis.2019.01.003 [PubMed]
- 43. Cheetham SW, Gruhl F, Mattick JS, Dinger ME. Long noncoding RNAs and the genetics of cancer. Br J Cancer. 2013; 108:2419–25. https://doi.org/10.1038/bjc.2013.233 [PubMed]
- 44. Taheri M, Omrani MD, Ghafouri-Fard S. Long non-coding RNA expression in bladder cancer. Biophys Rev. 2018; 10:1205–13. https://doi.org/10.1007/s12551-017-0379-y [PubMed]
- 45. Li Z, Feng C, Guo J, Hu X, Xie D. GNAS-AS1/miR-4319/NECAB3 axis promotes migration and invasion of non-small cell lung cancer cells by altering macrophage polarization. Funct Integr Genomics. 2020; 20:17–28. https://doi.org/10.1007/s10142-019-00696-x [PubMed]
- 46. Tamang S, Acharya V, Roy D, Sharma R, Aryaa A, Sharma U, Khandelwal A, Prakash H, Vasquez KM, Jain A. SNHG12: an LncRNA as a potential therapeutic target and biomarker for human cancer. Front Oncol. 2019; 9:901. https://doi.org/10.3389/fonc.2019.00901 [PubMed]
- 47. Wang Z, Zheng Y. lncRNAs Regulate Innate Immune Responses and Their Roles in Macrophage Polarization. Mediators Inflamm. 2018; 2018:8050956.
- 48. Huang Z, Luo Q, Yao F, Qing C, Ye J, Deng Y, Li J. Identification of differentially expressed long non-coding RNAs in polarized macrophages. Sci Rep. 2016; 6:19705. https://doi.org/10.1038/srep19705 [PubMed]
- 49. Song P, Jiang B, Liu Z, Ding J, Liu S, Guan W. A three-lncRNA expression signature associated with the prognosis of gastric cancer patients. Cancer Med. 2017; 6:1154–64. https://doi.org/10.1002/cam4.1047 [PubMed]
- 50. Yang H, Fang F, Chang R, Yang L. MicroRNA-140-5p suppresses tumor growth and metastasis by targeting transforming growth factor β receptor 1 and fibroblast growth factor 9 in hepatocellular carcinoma. Hepatology. 2013; 58:205–17. https://doi.org/10.1002/hep.26315 [PubMed]
- 51. Lan H, Chen W, He G, Yang S. miR-140-5p inhibits ovarian cancer growth partially by repression of PDGFRA. Biomed Pharmacother. 2015; 75:117–22. https://doi.org/10.1016/j.biopha.2015.07.035 [PubMed]
- 52. Zhai H, Fesler A, Ba Y, Wu S, Ju J. Inhibition of colorectal cancer stem cell survival and invasive potential by hsa-miR-140-5p mediated suppression of Smad2 and autophagy. Oncotarget. 2015; 6:19735–46. https://doi.org/10.18632/oncotarget.3771 [PubMed]
- 53. Zhang W, Zou C, Pan L, Xu Y, Qi W, Ma G, Hou Y, Jiang P. MicroRNA-140-5p inhibits the progression of colorectal cancer by targeting VEGFA. Cell Physiol Biochem. 2015; 37:1123–33. https://doi.org/10.1159/000430237 [PubMed]
- 54. Jing P, Sa N, Liu X, Liu X, Xu W. MicroR-140-5p suppresses tumor cell migration and invasion by targeting ADAM10-mediated Notch1 signaling pathway in hypopharyngeal squamous cell carcinoma. Exp Mol Pathol. 2016; 100:132–38. https://doi.org/10.1016/j.yexmp.2015.12.008 [PubMed]
- 55. Liu H, Deng H, Zhao Y, Li C, Liang Y. LncRNA XIST/miR-34a axis modulates the cell proliferation and tumor growth of thyroid cancer through MET-PI3K-AKT signaling. J Exp Clin Cancer Res. 2018; 37:279. https://doi.org/10.1186/s13046-018-0950-9 [PubMed]
- 56. Roberts WC, Siegel RJ, McManus BM. Idiopathic dilated cardiomyopathy: analysis of 152 necropsy patients. Am J Cardiol. 1987; 60:1340–55. https://doi.org/10.1016/0002-9149(87)90618-7 [PubMed]
- 57. Han D, Kim HY, Lee HJ, Shim I, Hahm DH. Wound healing activity of gamma-aminobutyric acid (GABA) in rats. J Microbiol Biotechnol. 2007; 17:1661–69. [PubMed]
- 58. Longbrake EE, Lai W, Ankeny DP, Popovich PG. Characterization and modeling of monocyte-derived macrophages after spinal cord injury. J Neurochem. 2007; 102:1083–94. https://doi.org/10.1111/j.1471-4159.2007.04617.x [PubMed]
- 59. Kigerl KA, Gensel JC, Ankeny DP, Alexander JK, Donnelly DJ, Popovich PG. Identification of two distinct macrophage subsets with divergent effects causing either neurotoxicity or regeneration in the injured mouse spinal cord. J Neurosci. 2009; 29:13435–44. https://doi.org/10.1523/JNEUROSCI.3257-09.2009 [PubMed]
- 60. Burgess AW, Metcalf D, Kozka IJ, Simpson RJ, Vairo G, Hamilton JA, Nice EC. Purification of two forms of colony-stimulating factor from mouse l-cell-conditioned medium. J Biol Chem. 1985; 260:16004–11. [PubMed]
- 61. Li L, Lv G, Wang B, Kuang L. The role of lncRNA XIST/miR-211 axis in modulating the proliferation and apoptosis of osteoarthritis chondrocytes through CXCR4 and MAPK signaling. Biochem Biophys Res Commun. 2018; 503:2555–62. https://doi.org/10.1016/j.bbrc.2018.07.015 [PubMed]
- 62. Díaz L, Martínez-Bonet M, Sánchez J, Fernández-Pineda A, Jiménez JL, Muñoz E, Moreno S, Álvarez S, Muñoz-Fernández MÁ. Bryostatin activates HIV-1 latent expression in human astrocytes through a PKC and NF-ĸB-dependent mechanism. Sci Rep. 2015; 5:12442. https://doi.org/10.1038/srep12442 [PubMed]