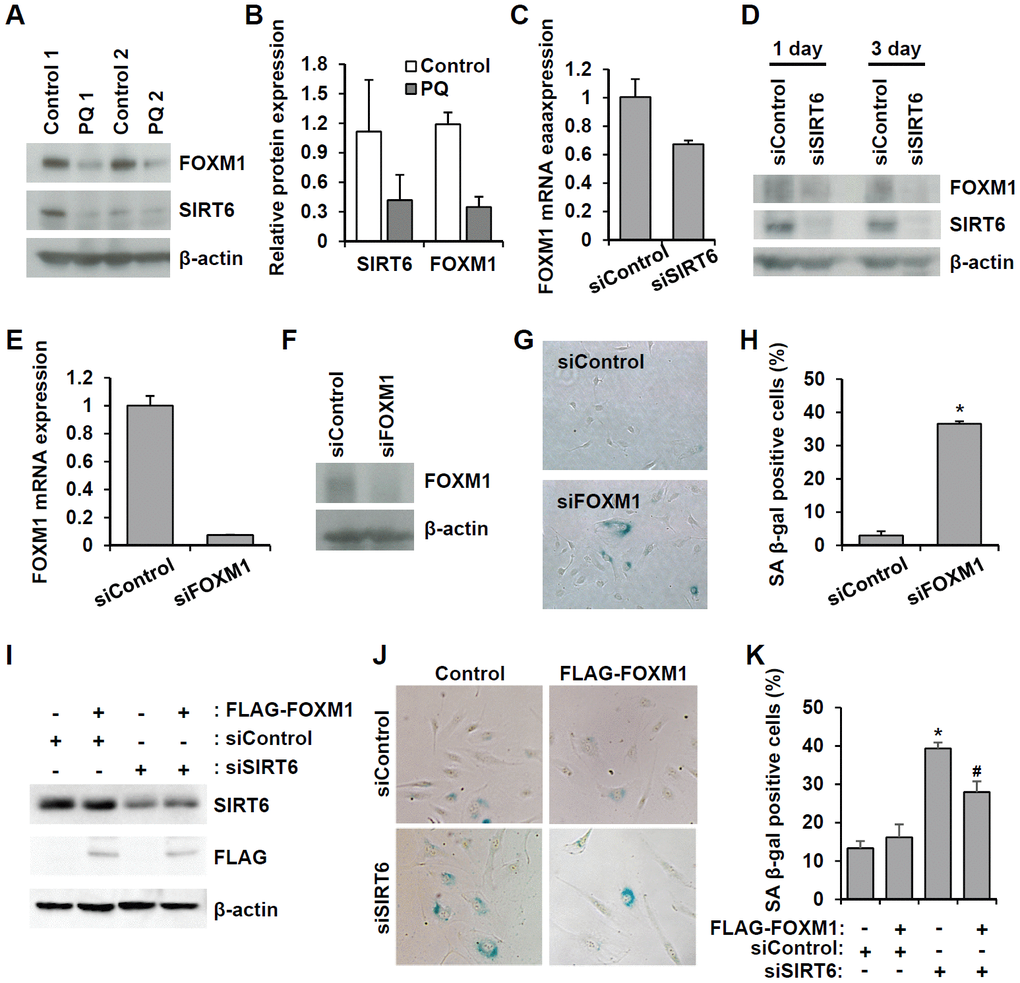
Figure 8.Downregulated SIRT6 expression inhibits FOXM1 expression, which is closely related to endothelial cell senescence. (A) Western blot analysis showing downregulation of FOXM1 and SIRT6 expression in thoracic aortas of mice treated with PBS or PQ. (B) Relative SIRT6 and FOXM1 protein expression in control and PQ-treated aortas. The protein expression was quantified using Bio-Rad Image Lab software. Relative expression was normalized to β-actin. (C) Real-time RT-PCR analysis indicating that SIRT6 knockdown transcriptionally inhibited FOXM1 expression. (D) Western blot analysis presenting the effect of SIRT6 knockdown on FOXM1 protein expression. (E) Real-time RT-PCR confirming the efficient knockdown of FOXM1 expression in endothelial cells by 25 nM FOXM1 siRNA. (F) Western blot analysis to show the knockdown of FOXM1 protein in FOXM1 siRNA-treated HUVECs. (G) Representative images of SA β-gal-positive senescent HUVECs that were transfected with control or FOXM1 siRNA. (H) Quantification of data from (G). The mean percentage of SA β-gal-positive cells was calculated, and error bars indicate SD (n = 3). *P < 0.001 vs. control siRNA. (I) Western blot analysis showing overexpression of FOXM1 in control or SIRT6 siRNA-treated endothelial cells. HUVECs were infected with 10 MOI of lentivirus vector encoding FLAG-tagged SIRT6. One day later, cells received the first transfection with 25 nM control or SIRT6 siRNA. Next, cells were transfected with the same siRNA 3 d after the first transfection. Six days after the first transfection, cells were analyzed for SIRT6 and FLAG-tagged FOXM1 expression. β-Actin was used as a loading control. (J) Representative images showing that overexpression of FOXM1 inhibited SIRT6 knockdown-induced endothelial cell senescence. Cells were stained for SA β-gal. (K) Quantification of data from (J). Data are expressed as the mean ± SD (n = 3). *P < 0.001 vs. control siRNA. #P < 0.01 vs. SIRT6 siRNA.