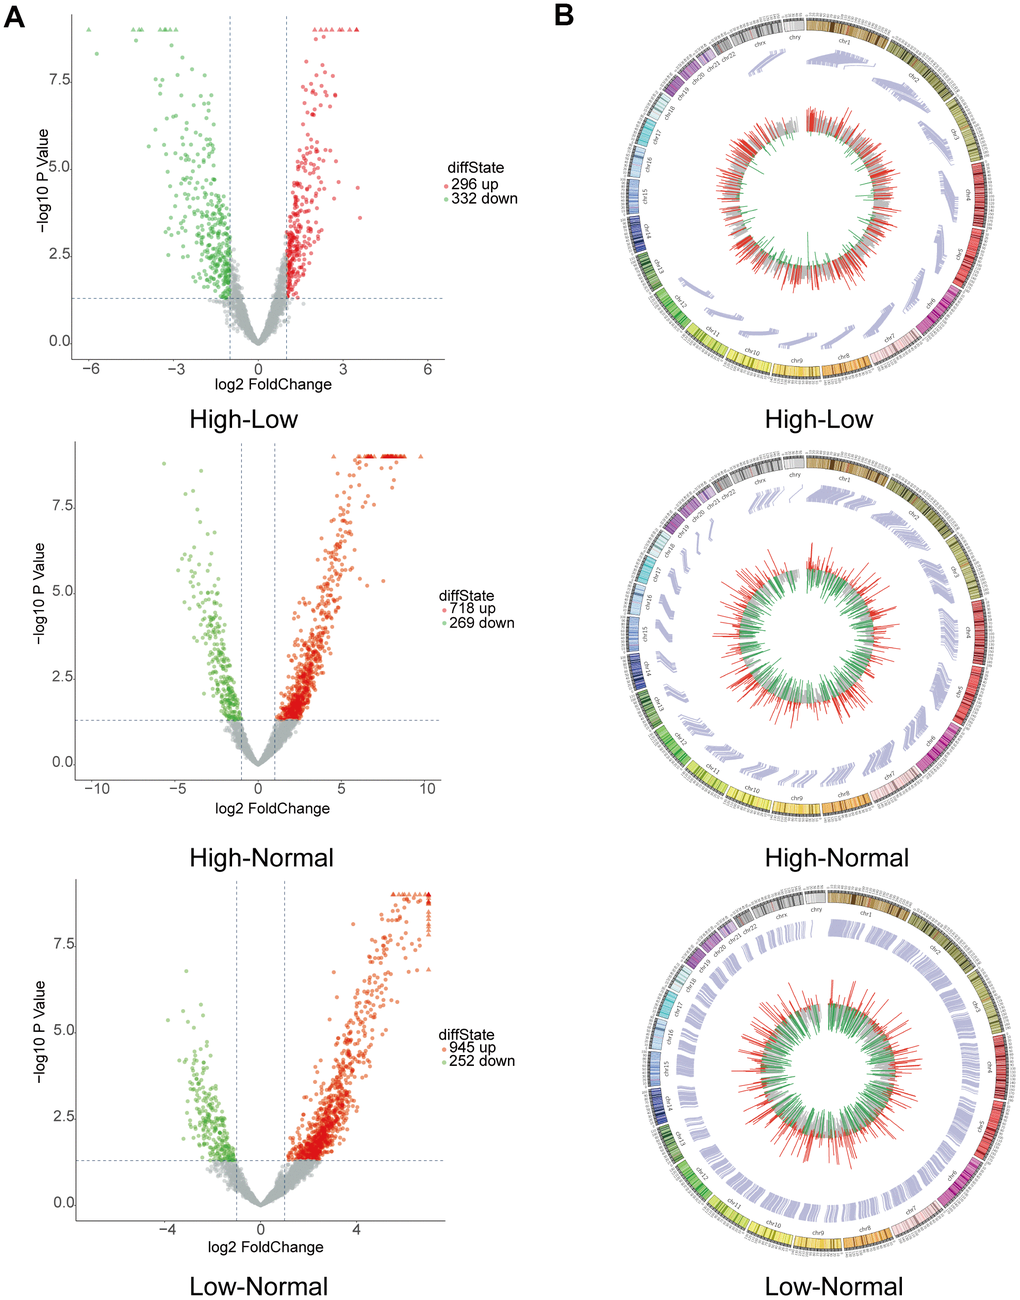
Figure 2.Bioinformatics analysis by RNA sequencing of circRNAs with differential expression. (A) Volcano plot depicting circRNAs. The volcano plot presents the expression profiles of each of the two groups. The vertical lines indicate a 2-fold (log2 scaled) increase and decrease in expression. The horizontal line indicates a p-value of 0.05 (−log10 scaled). CircRNAs showing significant upregulation are represented by red points. CircRNAs exhibiting significant downregulation are indicated by green points in the plot. (B) Circos plot revealing where each circRNA is located on human chromosomes.