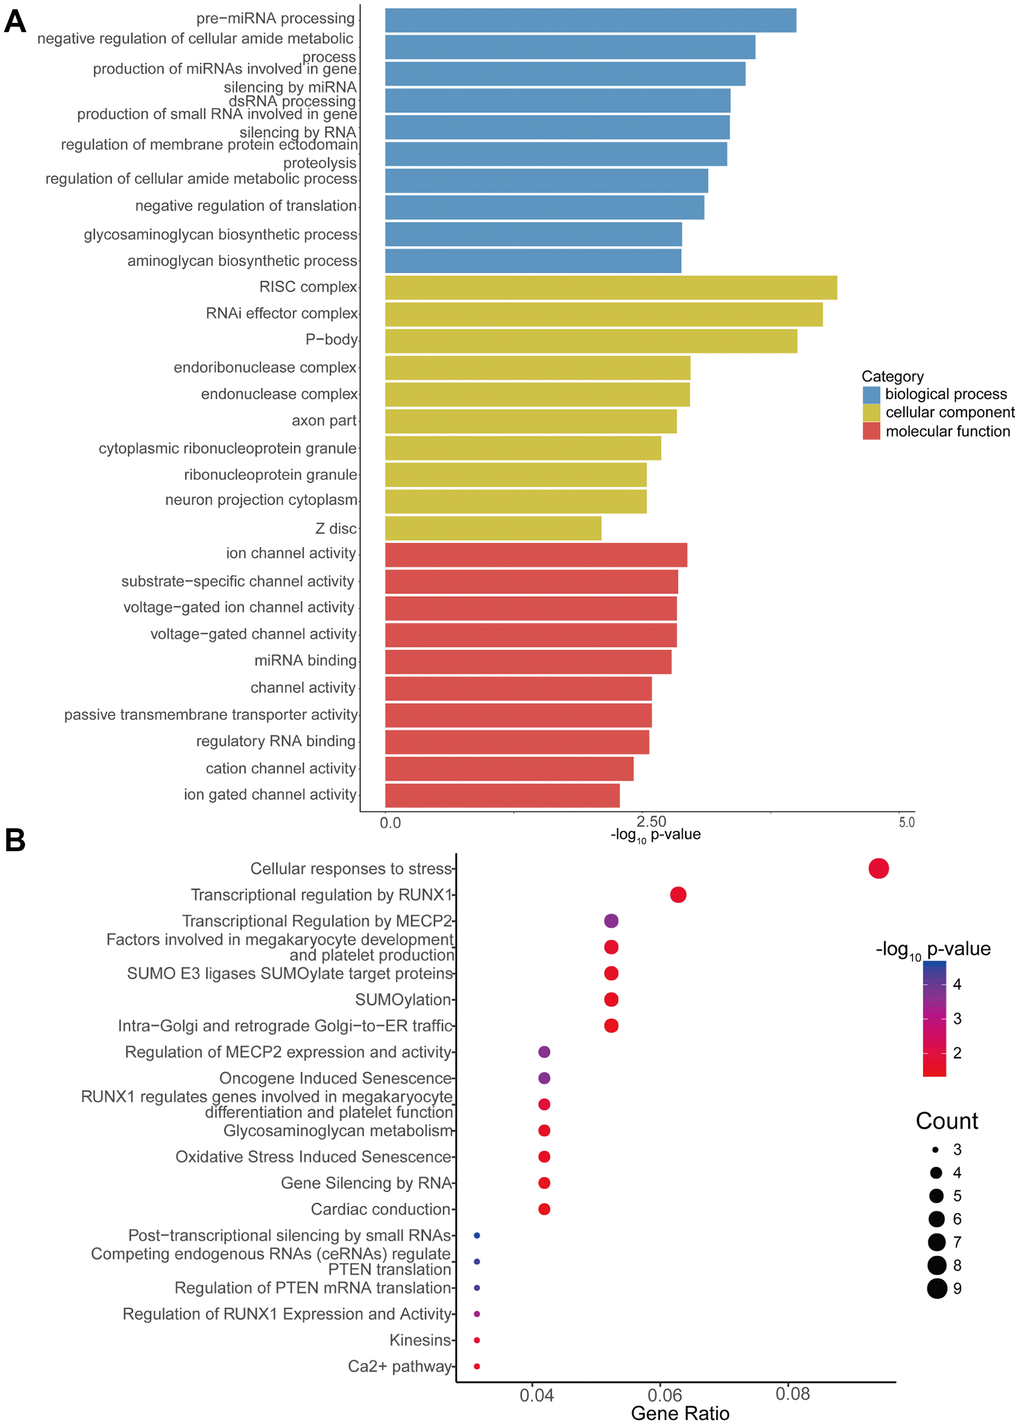
Figure 5.GO enrichment and Reactome pathway analyses of target genes of differentially expressed circRNAs. (A) GO enrichment analysis of target genes for circRNAs with differential expression. The 10 most significantly enriched GO terms in the MF, BP, and CC for the target genes of all miRNAs with differential expression. (B) Bubble map of Reactome pathway analysis of the top 20 predominant pathways. The X-axis denotes the enriched differential gene ratio in each pathway. The Y-axis represents the name of the significantly enriched pathway. The p-values are expressed as variations from red to blue. A deeper blue color indicates a greater significant difference.