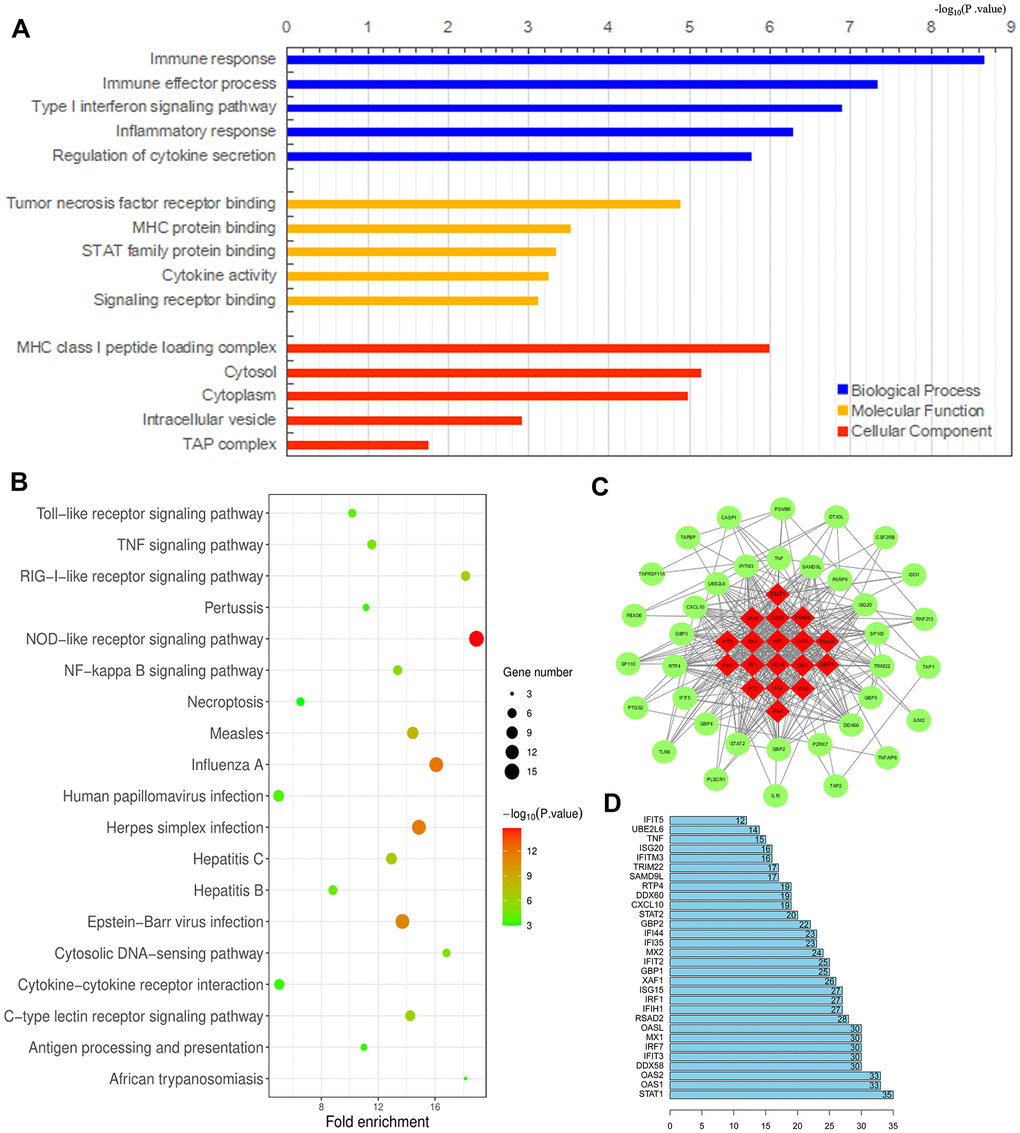
Figure 9.Analysis of DEGs between M1 and M2 macrophages. (A, B) Histogram of enriched GO terms (BP: Biological Process, MF: Molecular Function, CC: Cellular Component) (A) and bubble plot of enriched KEGG pathways (B). The rank criterion was an FDR < 0.05. The abscissa represents the percentage of DEGs enriched in each term or pathway; the size represents the number of DEGs enriched in each item or pathway; and the color represents the adjusted P-value. (C) PPI network constructed from 54 hub genes, with the red region representing the most closely connected module. A comprehensive Gt score > 0.7 was considered statistically significant. (D) Top 30 genes with the greatest degree of differential expression. The ordinate lists the gene name and the abscissa represents the degree of differential expression.