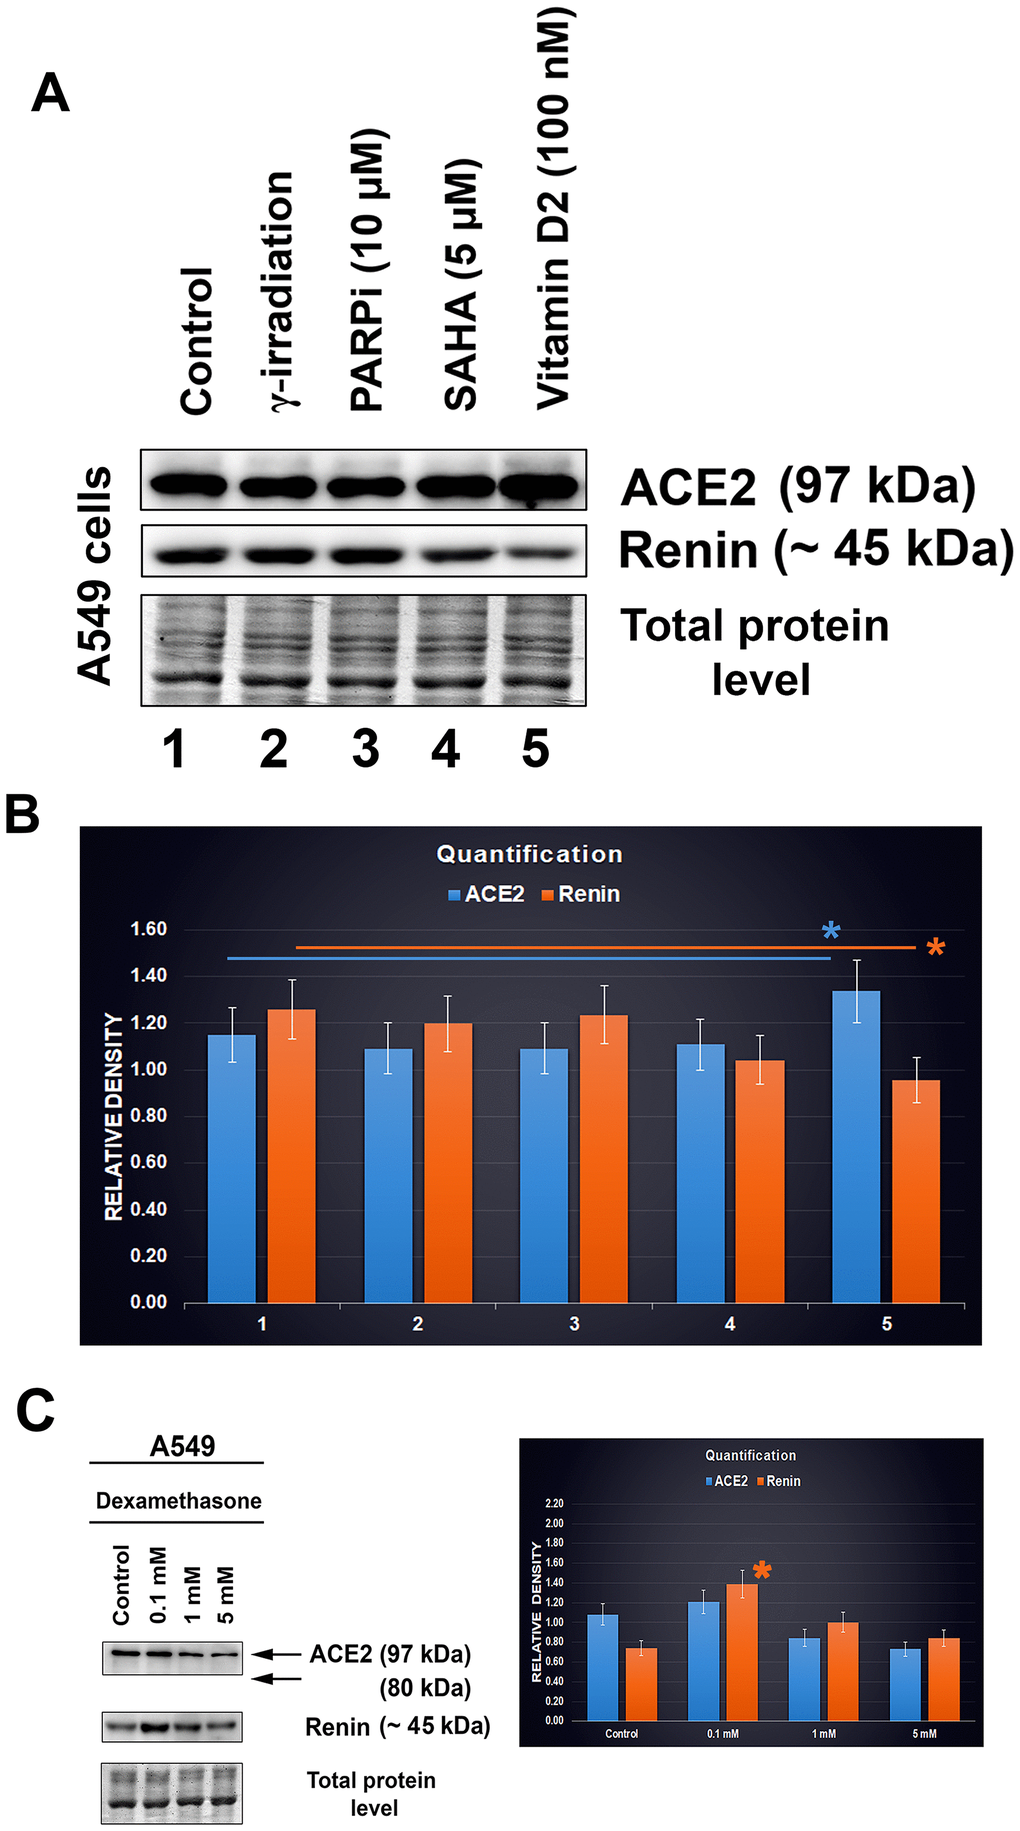
Figure 7.ACE2 and renin levels after distinct treatments of A549 cells. (A, B) The effect of the following drugs was analyzed: γ-irradiation, PARP inhibitor (olaparib), HDAC inhibitor (SAHA), and vitamin D2. © Level of ACE2 in dexamethasone-treated A549 cells. The data were normalized to the total protein levels, as shown in the bar chart. Quantification of the protein levels, as assessed by western blotting, was performed using ImageJ software. The blue asterisk indicates a slight increase in the ACE2 level, and orange asterisk shows the renin level decrease, in cells treated with vitamin D2 (panel B). The orange asterisk in panel C indicates renin upregulation caused by dexamethasone treatment. The data were analyzed by the nonparametric Mann–Whitney test.